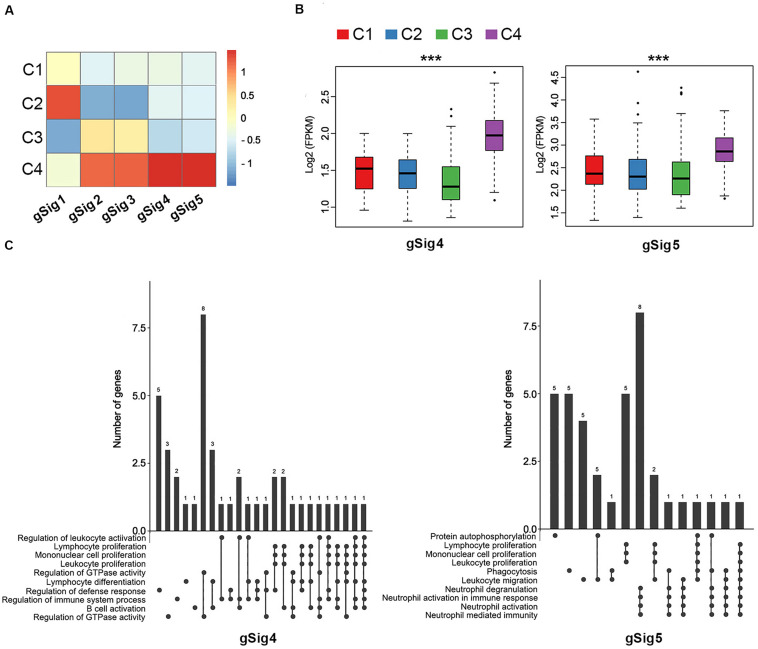
FIGURE 2.
The correlation between immune subtypes and gene module signatures in TCGA. (A) The heatmap of expression of the gene module signatures among the C1–C4 immune subtypes. (B) The expression of gSig4 and gSig5 in the C1–C4. (C) UpSet plot shows the significant enrichment of Gene Ontologies (GO) of gSig4 and gSig5. The bar chart above represents the number of genes contained in each type of group. The dotted line at the bottom right shows the types of events contained in the group. ***P < 0.001.

