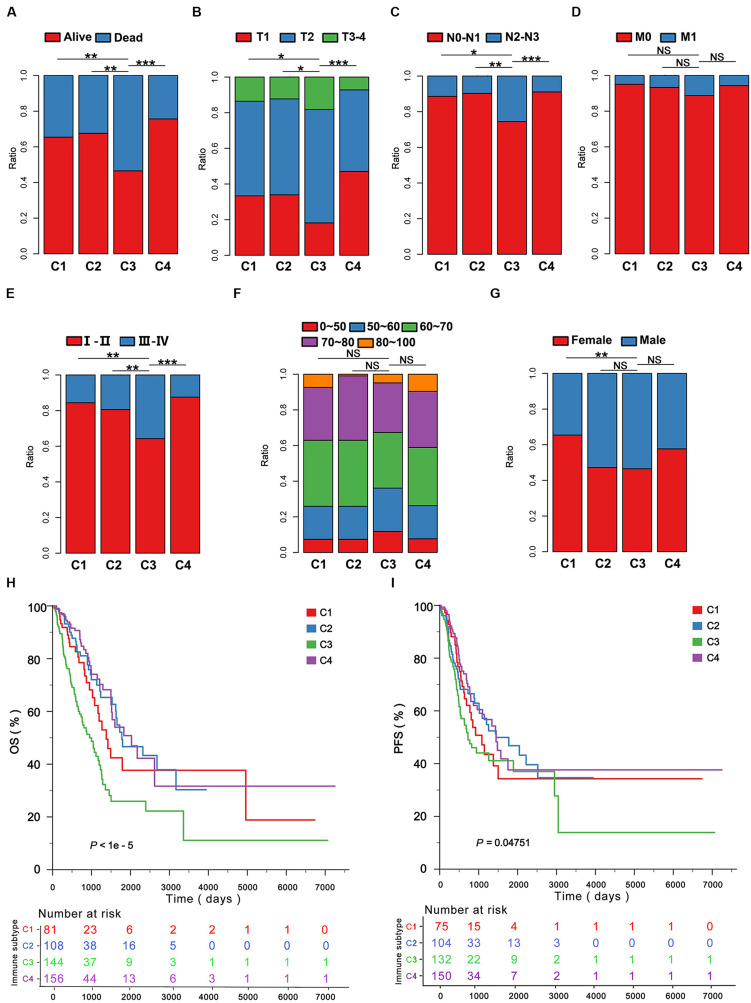
FIGURE 3.
The clinicopathological signatures of the immune subtypes in TCGA. The patients were classified according to the clinical features including (A) survival event, (B) T stage, (C) N stage, (D) M stage, (E) TNM stage, (F) age, (G) gender in the immune subtypes. (H,I), Five-year Kaplan–Meier curves for overall survival (OS) and progression-free survival (PFS) of LUAD patients from the TCGA cohort stratified by the immune subtypes. The P-value was calculated by the log-rank test among subtypes. *P < 0.05, **P < 0.01, ***P < 0.001.

