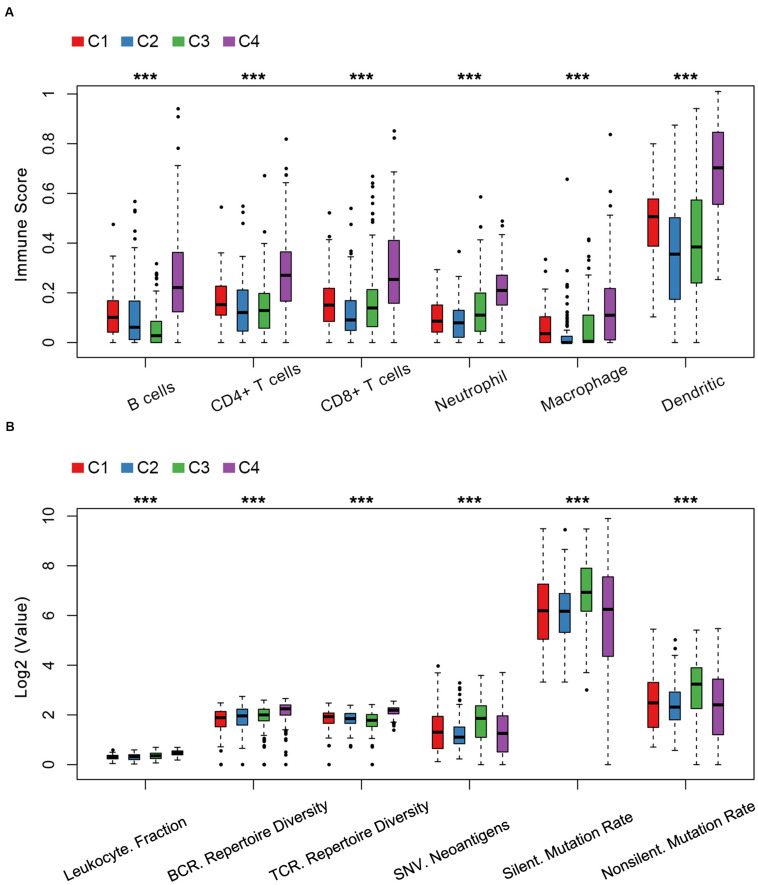
FIGURE 4.
Cellular and molecular features of LUAD immune subtypes in TCGA. (A) Immune score distribution of six immune cells in immune subtypes among the C1–C4 immune subtypes. (B) The index distribution of leukocyte fraction, BCR/TCR repertoire diversity, single nucleotide variant (SNV) neoantigen, silent mutation rate and non-silent mutation rate among the C1–C4 immune subtypes. Kruskal–Wallis test was used. ***P < 1e-5.

