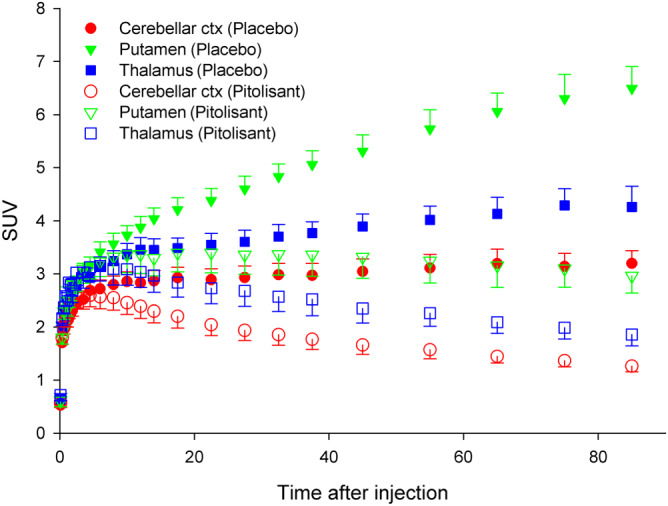
FIGURE 2.

Time activity curves (TACs) for the putamen, thalamus and cerebellar cortex which are known to have high, medium and low concentration of H3 receptors respectively. Following pitolisant, the TACs showed a dramatic change of shape, consistent with fewer receptors available for binding. While after placebo, the TACs did not start to decay within the scan period of 90 min, after pitolisant they showed a peak followed by a washout of activity. TACs were normalized by activity injected and weight of the subject and are expressed in standard uptake values (SUV). The data shown are means ± SD; n = 6
