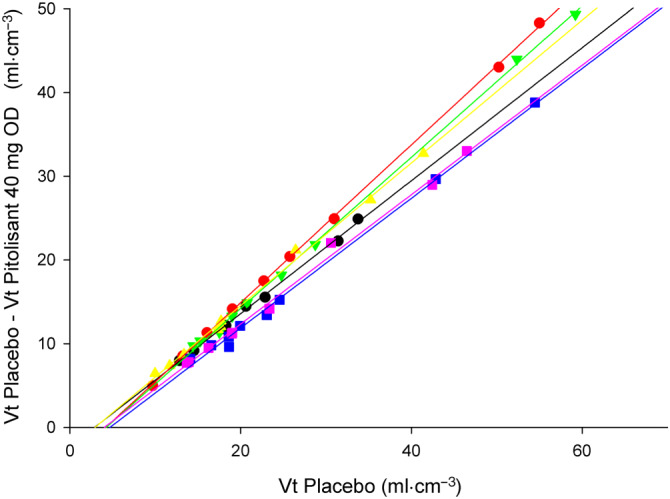
FIGURE 3.

The Lassen plots (difference of the total distribution volume (Vt) between scans and the Vt after placebo) presented a good linearity. Each colour represents a subject and each symbol represents the data for an anatomical brain region. The slope of the lines in the Lassen plot provides the brain occupancy (one per subject), at peak plasma concentration (3 hours) following an oral dose (OD) of 40 mg of pitolisant
