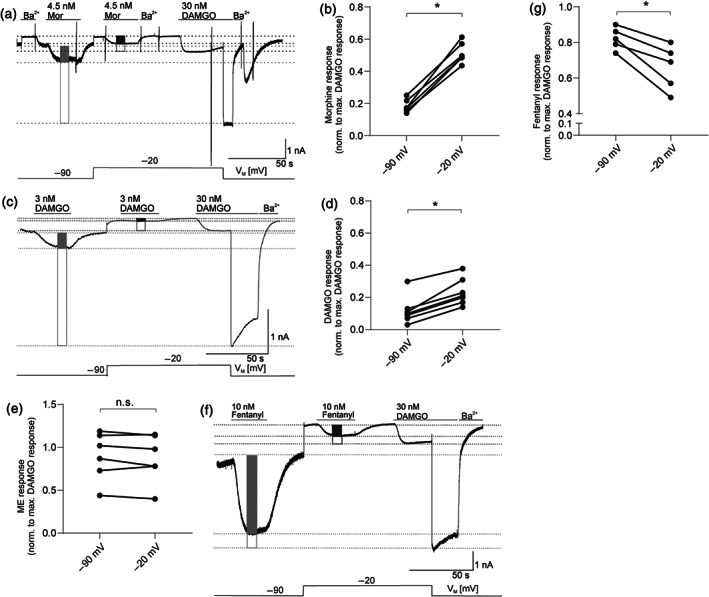
FIGURE 1.

Membrane potential regulates μ receptor‐induced Kir3.X currents in HEK293T cells. (a) Representative recording (out of n = 6) of inward K+ currents in HEK293T cells expressing wild‐type μ receptors (MOP‐wt) and Kir3.X channels is shown. Kir3.X currents were evoked by 4.5 nM morphine (Mor) and 30 nM DAMGO and measured at −90 and −20 mV (voltage protocol is depicted at the bottom; note that depolarization to −20 mV shifts both basal and active currents due to the current–voltage relationship [see Figure S1] of the channel). Levels that were used for calculation of maximum responses are shown as light grey line (−90 mV) or dark grey line (−20 mV), and amplitude height is shown by boxes (morphine response: filled box; maximum DAMGO response: empty box). (b) Kir3.X current responses evoked by non‐saturating morphine concentrations were normalized to the maximum response (evoked by a saturating DAMGO concentration) at respective membrane potentials (n = 6, for further explanation of evaluation, see Section 2). (c) Representative recording (out of n = 7) of inward K+ currents. Kir3.X currents were evoked by 3 nM morphine and 30 nM DAMGO and measured and evaluated as explained in (a) (non‐saturating DAMGO response: filled box; saturating response: empty box). (d) Kir3.X current responses evoked by non‐saturating DAMGO concentrations were normalized to the maximum response (evoked by a saturating DAMGO concentration) at respective membrane potentials (n = 7, for further explanation of evaluation, see Section 2). Responses at −90 and −20 mV were compared in the same recording. *P < 0.05, significantly different as indicated; paired two‐sample Wilcoxon test. (e) Kir3.X current responses evoked by non‐saturating Met‐enkephalin concentrations were normalized to the maximum response (evoked by a saturating DAMGO concentration) at respective membrane potentials (n = 6, for further explanation of evaluation, see Section 2). (f) Representative recording (out of n = 5) of inward K+ currents. Kir3.X currents were evoked by 10 nM fentanyl and 30 nM DAMGO and measured at −90 and −20 mV and measured and evaluated as explained in (a) (fentanyl response: filled box; saturating DAMGO response: empty box). (g) Kir3.X current responses evoked by non‐saturating fentanyl concentrations were normalized to the maximum response (evoked by a saturating DAMGO concentration) at respective membrane potentials (n = 5, for further explanation of evaluation, see Section 2). (a, c, f) Kir3.X channels were blocked with barium (500 μM) at several time points as indicated. (b, e, g) As responses at −90 and −20 mV were compared in the same recording, statistics were performed using a paired, two‐tailed t‐test (n.s.: P > 0.05, *P < 0.05)
