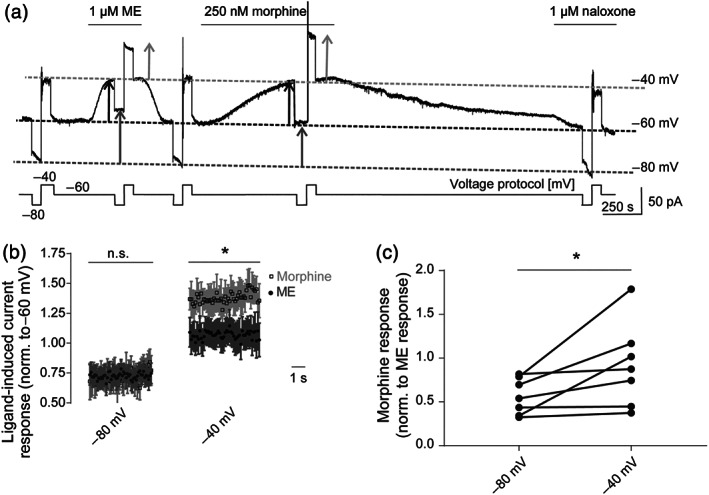
FIGURE 3.

Voltage sensitivity of morphine‐induced Kir3.X currents can be detected in physiological tissue. (a) Representative recording of outward K+ currents in LC neurons. Kir3.X currents were evoked by non‐saturating concentrations of morphine (Mor; 250 nM) or Met‐enkephalin (ME; 1 μM). During measurements, cells were kept at −60 mV and briefly clamped to −80 and −40 mV in turn (voltage protocol is depicted below the current trace). Initially, baseline current responses at each membrane potential were determined by voltage steps in control aCSF, followed by responses in the presence of ME and then morphine. To accelerate washout of morphine, naloxone (1 μM) was applied afterwards. Dotted lines depict the baseline currents at each holding potential (dark grey: −80 mV; black: −60 mV; light grey: −40 mV). The magnitude of agonist‐induced currents at each holding potential is shown as arrows (dark grey: −80 mV; black: −60 mV; light grey: −40 mV). (b) Average (mean ± SEM) time course of current responses following application of non‐saturating concentrations of morphine or Met‐enkephalin. For each agonist, individual responses at −80 and −40 mV were normalized to current responses of the respective ligand at −60 mV. *P < 0.05, significantly differences as indicated, between ME and morphine responses at −40 mV; n = 7. (c) Kir3.X currents (as shown in Figure 3a) evoked by a non‐saturating morphine concentration were normalized to current responses evoked by a non‐saturating Met‐enkephalin concentration at respective membrane potentials, and the relative voltage‐dependent effect induced by morphine was compared at −80 and −40 mV, without normalization to individual cell responsiveness at −60 mV. *P < 0.05, significantly different as indicated; paired t‐test; n = 7
