
FIGURE 5.
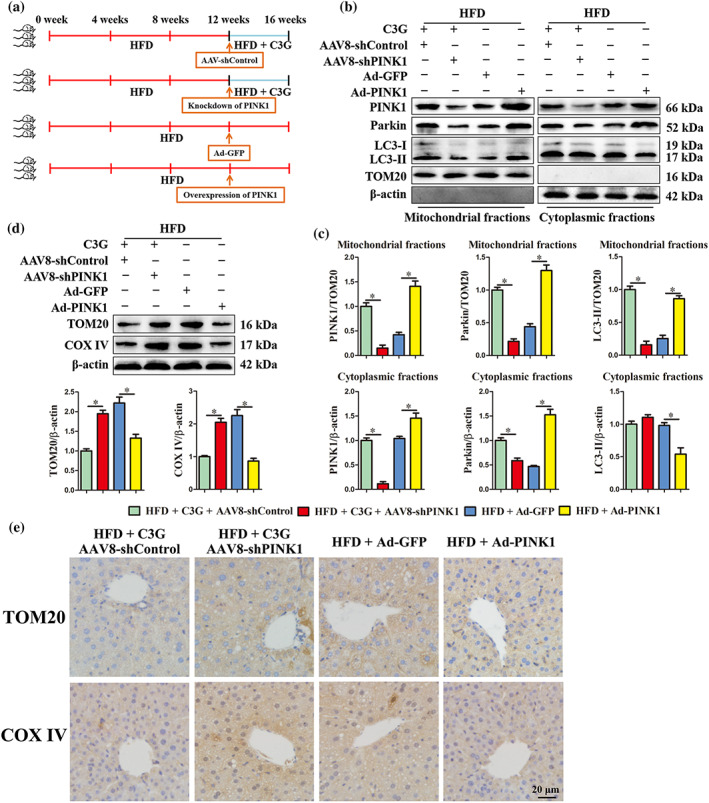
Knockdown of PINK1 blocks cyanidin‐3‐O‐glucoside (C3G)‐induced hepatic mitophagy. (a) Schematic of the experimental design. (b–e) Mice were treated as shown in Figure 6a (n = 9 mice per group). (b, c) Protein levels of PINK1, Parkin and LC3 in mitochondrial or cytoplasmic fractions of the livers from different groups. (d) Hepatic protein abundance of TOM20 and COX IV in the livers from different groups. (e) Representative images of hepatic IHC staining for TOM20 and COX IV in different groups (original magnification 40×). Data were expressed as the mean ± SEM. * P < 0.05