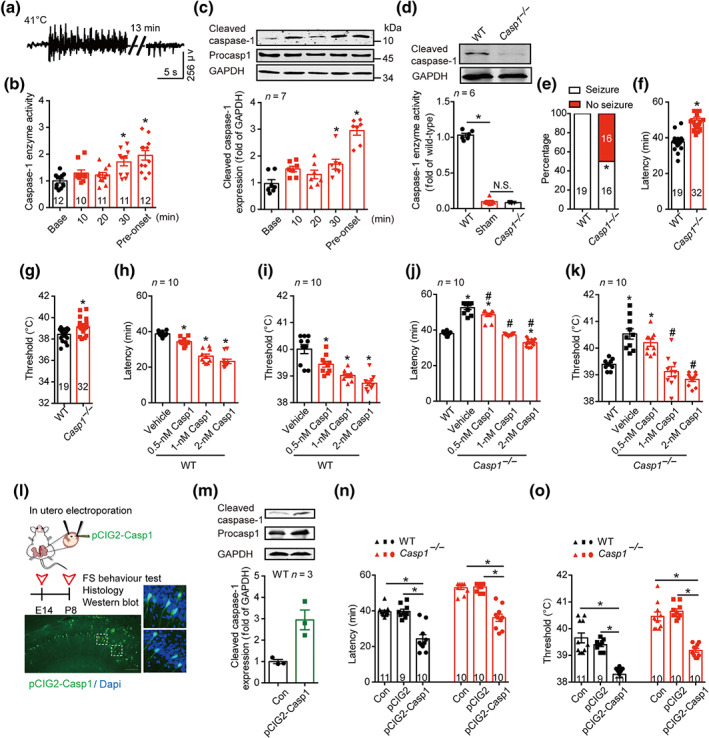
FIGURE 1.

Cleaved caspase‐1 mediates FS generation. (a) Typical EEG of FS onset at 41°C. (b) The enzyme activity of caspase‐1 at different time points at 41°C. (c) The amount of caspase‐1 at different time points at 41°C, was analysed by western blotting with indicated antibodies. Data were quantified and normalized against the base. (d) Enzyme activity and protein level of caspase‐1 in WT (C57BL/6J) and Casp1 −/− mice at P8 age in basal condition. (e–g) The percentage of seizure (e), latency (f) and threshold (g) to FS generation at 41°C in WT and Casp1 −/− mice. (h–k) The latency and threshold to FS generation after intra‐hippocampal injection of caspase‐1 (0.5, 1 and 2 nM) to WT (h, i) and Casp1 −/− mice (j, k). (l) Experimental paradigm and the transfected caspase‐1 in the hippocampus after in utero electroporation of pCIG2‐Casp1. green, caspase‐1, blue, Dapi, scale bar: 100 μm. (m) The amount of caspase‐1 after in utero electroporation of pCIG2‐Casp1 was analysed by western blotting with indicated antibodies, and the data were quantified. ‘CON’ group have all same procedures of in utero electroporation, but except the delivery of pCIG2‐Casp1 plasmid. The length of procasp1 sequence is 1,533 bp, but the sequence we inserted in the pCIG2 is 1,209 bp, with the same beginning as the cleaved caspase‐1. (n, o) The latency (n) and threshold (o) to FS generation in WT and Casp1 −/− mice after in utero electroporation of pCIG2 and pCIG2‐Casp1. Data are presented as means ± SEM. *P < .05, significantly different from baseline, WT, vehicle or as indicated; # P<.05, significantly different from vehicle in i and j. One‐way ANOVA followed by Dunnett post hoc test was used for (b), (c), (h) and (i). Fisher exact test was used for (e). Unpaired t test was used for (f) and (g). Two‐way ANOVA followed by Bonferroni post hoc test was used for (d), (j), (k), (n) and (o)
