Figure 2.

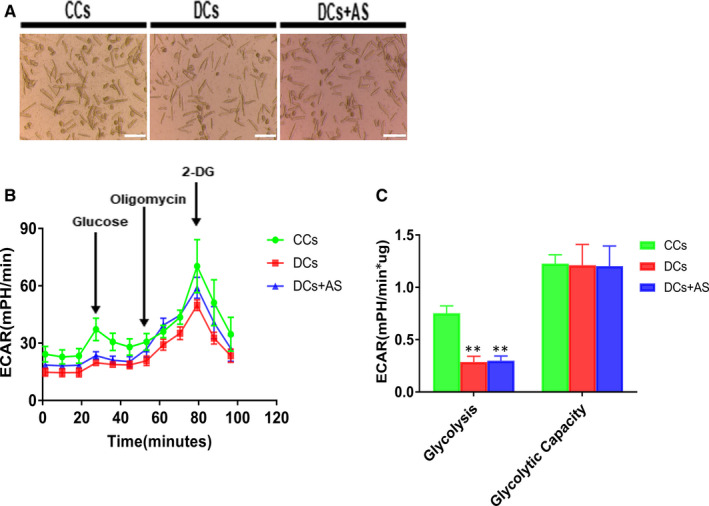
AS treatment did not affect glycolytic flux and glycolytic capacity in isolated diabetic cardiomyocytes. A, Isolated cardiomyocytes were seeded onto matrix gel–coated Seahorse XF24 Cell Culture Plates (8000 cells/well) treated with or without 1 μM AS for 24 h. Scale bar, 200 μm. B, Kinetic extracellular acidification rate (ECAR) responses of isolated cardiomyocytes to glucose (10 mM), oligomycin (1 μM) and 2‐DG (100 mM). C, Calculated glycolytic flux and glycolytic capacity. The former one is calculated by the ECAR increase (ECAR value of measurement 3 subtracted by measurement 4) normalized with cell protein content. The latter one is calculated by the ECAR increase (ECAR value of measurement 3 subtracted by measurement 9) normalized with cell protein content. Control cardiomyocytes (CCs); diabetic cardiomyocytes (DCs); AS‐treated diabetic cardiomyocytes (DCs + AS); AS, AS1842856; 2‐DG, 2‐deoxy‐glucose. Data are expressed as means ± SEM (n = 6). **P < .01 vs CCs
