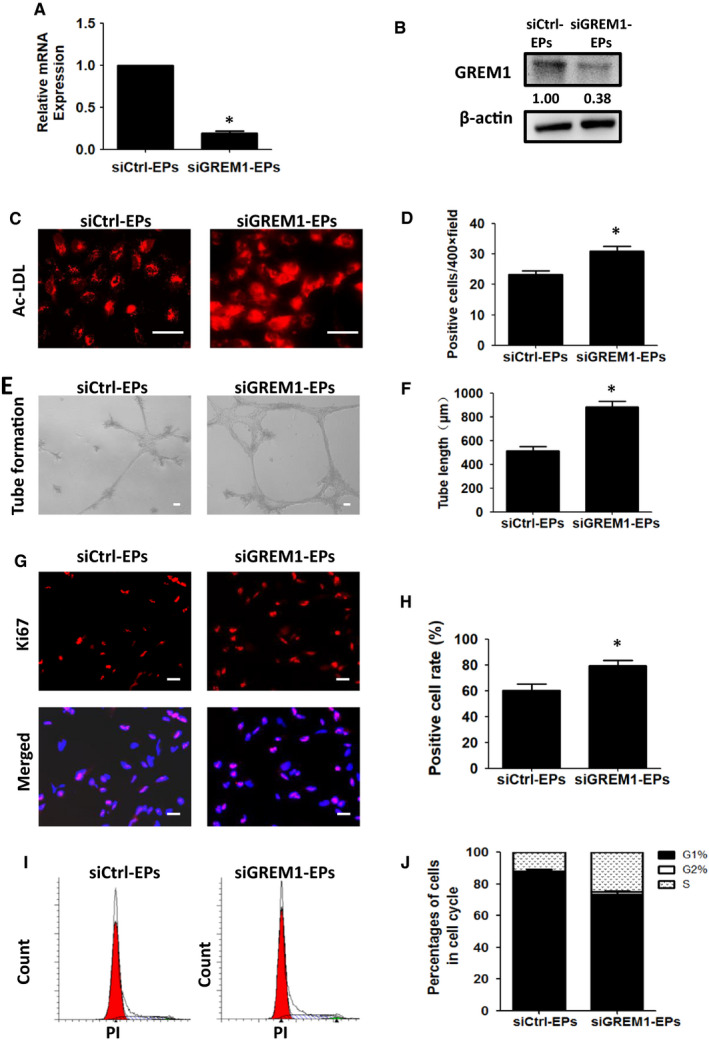
Figure 3.

Knock‐down of GREM1 during Stage 1 promoted the differentiation and expansion of EPs. A, GREM1 mRNA expression was detected by qPCR in siCtrl‐EPs and siGREM1‐EPs. B, GREM1 protein was determined by WB. C, Ac‐LDL uptake in siGREM1‐EPs and siCtrl‐EPs was detected. D, Quantified data were analysed. E, Tube formation in siGREM1‐EPs or siCtrl‐EPs was detected. F, Quantified data were analysed. G, Ki67 expression was tested by immunofluorescence. H, Quantified data were analysed. I, Cell cycle was detected by FACS. J, Quantified data were analysed. The data represent mean ± SEM of three independent experiments. *P < .05. Scale bar: 50 μm
