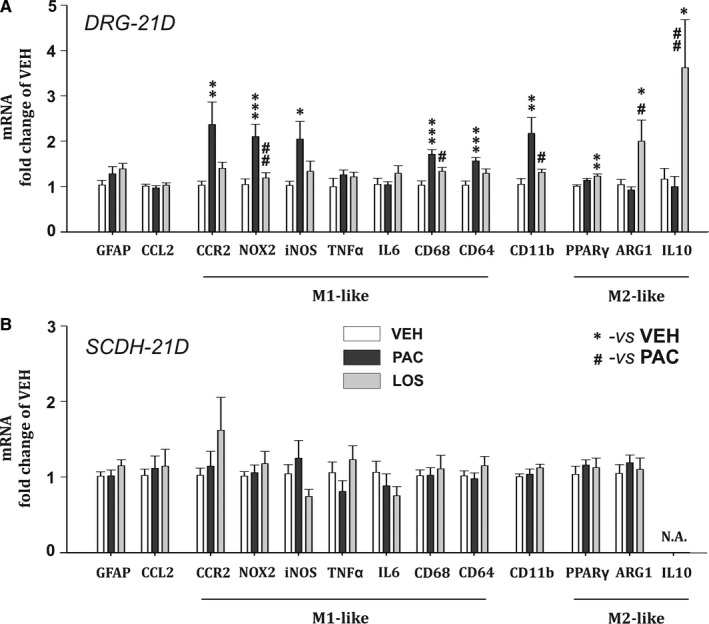
Figure 5.

mRNA levels relative to the housekeeping gene β‐actin in the DRG (A) and the SCDH (B), measured during the chronic phase of PIPN. One‐way ANOVA followed by Holm‐Sidak post hoc test was used for the statistical comparison. Asterisks indicate the significance of the comparisons to the VEH group (*P ≤ .05, **P ≤ .01, ***P ≤ .001). Pound signs were used to depict the significant differences when compared to the PAC group (#P ≤ .05, ##P ≤ .01)
