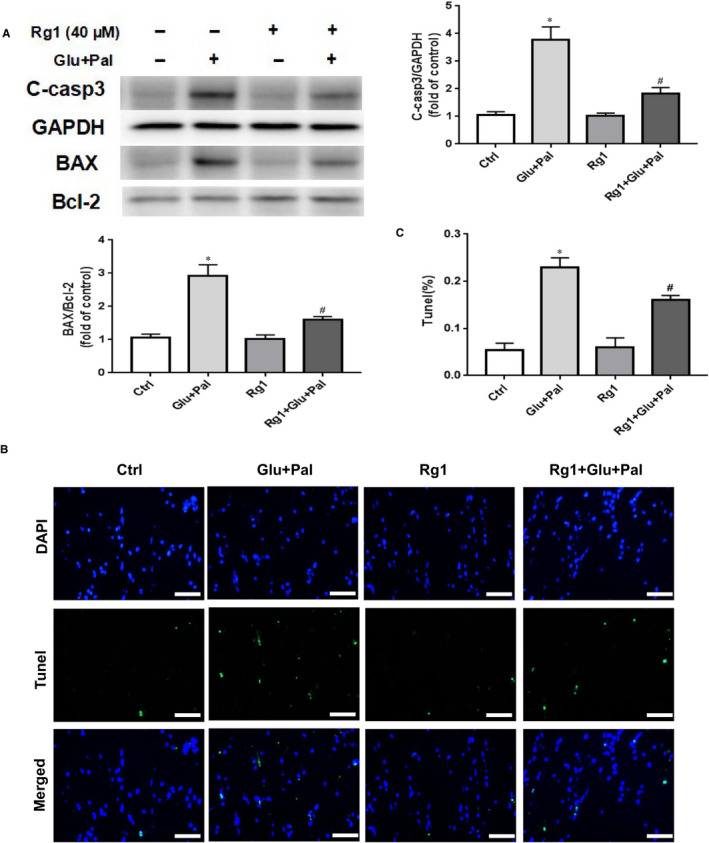
Figure 2.

Protective effect of Rg1 on G&P‐induced H9C2 cell apoptosis. A, Cleaved caspase‐3, BAX and Bcl‐2 expression in each treatment group (control; Glu + Pal; Rg1; Rg1 + Glu +Pal); n = 5 per group. B, Representative immunofluorescent staining for terminal transferase dUTP nick end labelling assay (TUNEL, green) and nuclei (DAPI (4′,6‐diamidino‐2‐phenylindole), blue); 40× magnification. Scale bar = 50 μm. C, Summary of TUNEL data for each group (n = 5 per group). *P < .05 vs control group, #P < .05 vs Glu + Pal group
