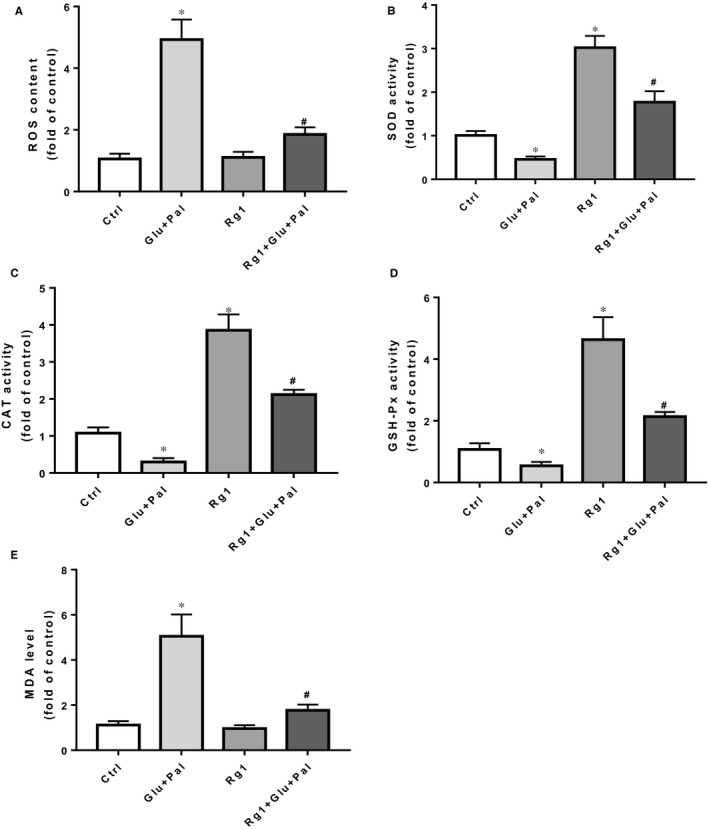
Figure 3.

Rg1 reduced G&P‐induced ROS formation and increased intracellular antioxidant enzyme activity. Effects of Rg1 on G&P‐induced intracellular ROS formation (A), SOD activity (B), CAT activity (C), GSH‐Px activity (D) and MDA levels (E) of different groups in H9C2 cells. n = 5 per group. *P < .05 vs control group, # P < .05 vs Glu + Pal group
