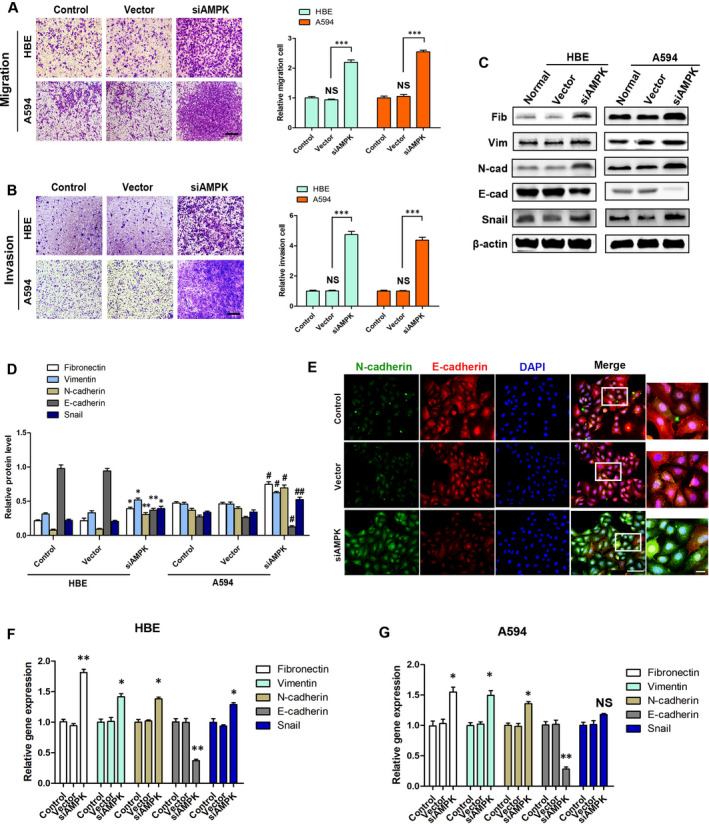
FIGURE 3.

Low AMPK induces EMT in HBE cells. A, B, The migration and invasion of HBE cells and A549 cells with siAMPK and vector control, ***P < .001, NS, P > .05, vs the indicated group, bar = 100 μm, n = 3. C, D, Western blot determination of EMT‐related markers E‐cadherin, N‐cadherin, vimentin, fibronectin and snail protein expression, *P < .05, **P < .01 vs the vector group in HBE cells; #P < .05, ##P < .01 vs the vector group in A549 cells, n = 3. E, Immunofluorescence analysis of the expression of E‐cadherin (red) and N‐cadherin (green) in HBE cells, bar (left) = 10 μm, bar (right) = 5 μm. F, G, Relative mRNA expression levels of EMT markers and inducer in HBE cells and A549 cells, *P < .05, **P < .01 vs the respective vector group, n = 3
