
FIGURE 5.
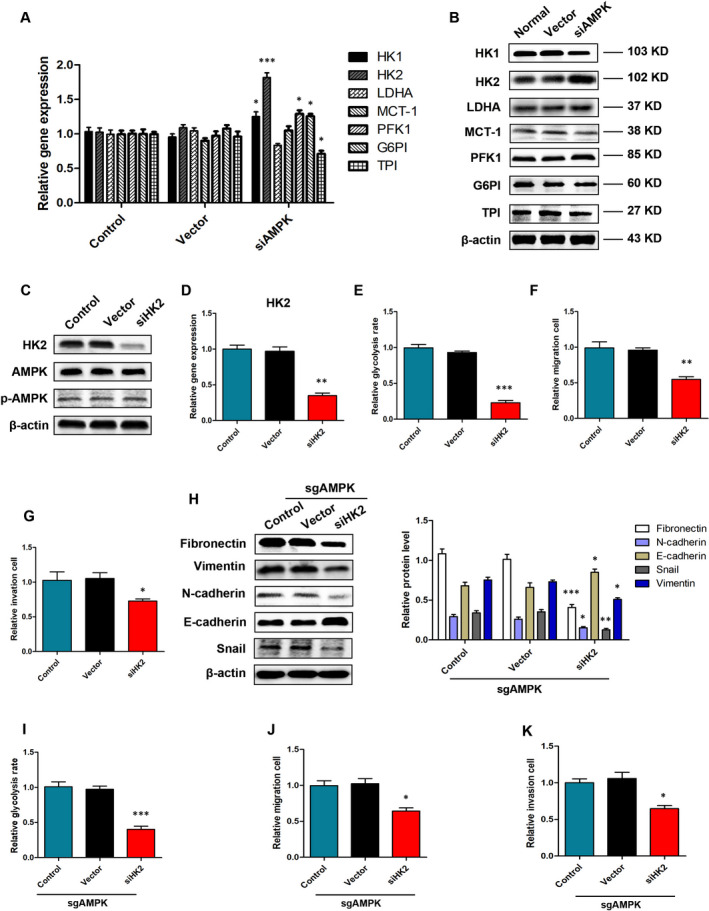
Low AMPK promotes glycolysis by up‐regulating the expression of HK2 in HBE cells. A, B, Relative mRNA and protein expression levels of HK1, HK2, LDHA, G6PI,TPI, MCT‐1 and PFK‐1 in HBE cells, *P < .05, ***P < .001, vs the Vector group, n = 3. C, D, Relative mRNA and protein expression levels of HK2, AMPK and p‐AMPK in HBE cells. E‐G, Relative glycolysis rates, migration, invasion in response to siHK2 treatment, *P < .05, **P < .01, ***P < .001 vs the respective vector group in HBE cells, n = 3. H, Western blot determination of EMT‐related markers protein expression in response to siHK2 treatment in sgAMPK HBE cells, *P < .05, **P < .01, ***P < .001 vs the vector group, n = 3. I‐K, Relative glycolysis rates, migration, invasion in response to siHK2 treatment, *P < .05, **P < .01, ***P < .001 vs the respective vector group in sgAMPK HBE cells, n = 3