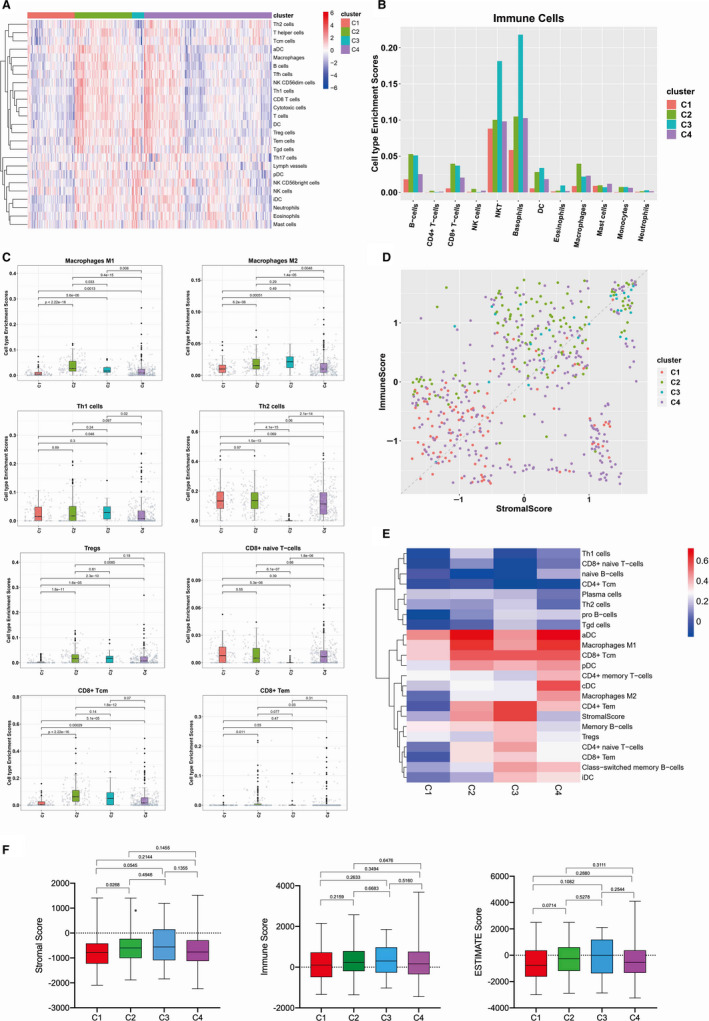
Figure 2.

Composition of tumour immune infiltrate in EC. A, The heatmap of immune cells for different immune subtypes. For each immune subtypes, we calculated the median of the absolute score of the 22 cell types given by the CIBERSORT in each cohort. B, The proportion of major classes of immune cells (from CIBERSORT) for different immune subtypes. C, List of major immune cell distribution in different EC immune subtypes. D, Immune score (y axis) versus stromal score in the TME (x axis) for four representative immune subtypes. Dots represent individual tumour samples. E, The correlation between Immune Score's Spearman and the heatmap in each group. F, Immune score, stromal score and calculated ESTIMATE score in different immune subtypes. Box plot shows that there is significant association between immune subtypes and the level of above mentioned scores
