
Figure 5.
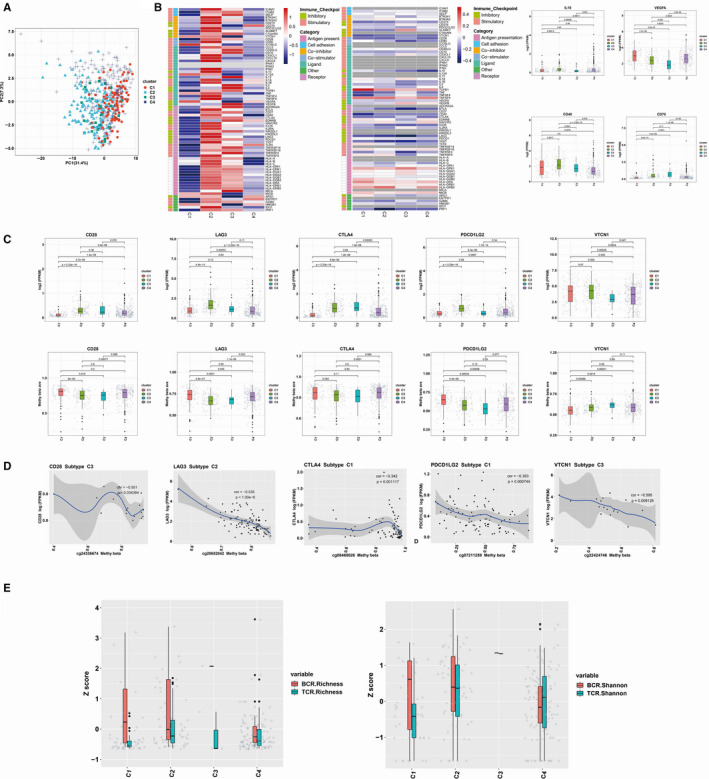
Regulation of immunomodulators and IM genes Expression Correlation with DNA Methylation. A, Principal component analysis between four immune subtypes based on immune genes. Dots represent individual tumour samples. B, Distribution of log‐transformed expression levels for IM genes with the largest differences across subtypes by Kruskal‐Wallis test. C, CD28, LAG3, CTLA4, PDL2 and VCTN1 expression were inversely correlated to methylation levels in certain immune subtypes. Each point represents a tumour sample, and colour indicates point density. D, From left to right: mRNA expression (median normalized expression levels); expression versus methylation (gene expression correlation with DNA methylation beta‐value); the differences in IM genes in the particular subtype and the amplification fraction in all samples); and the deletion frequency (as amplifications) for 75 IM genes by immune subtypes. E, BCR and TCR diversity measured by species richness and Shannon entropy in different immune subtypes