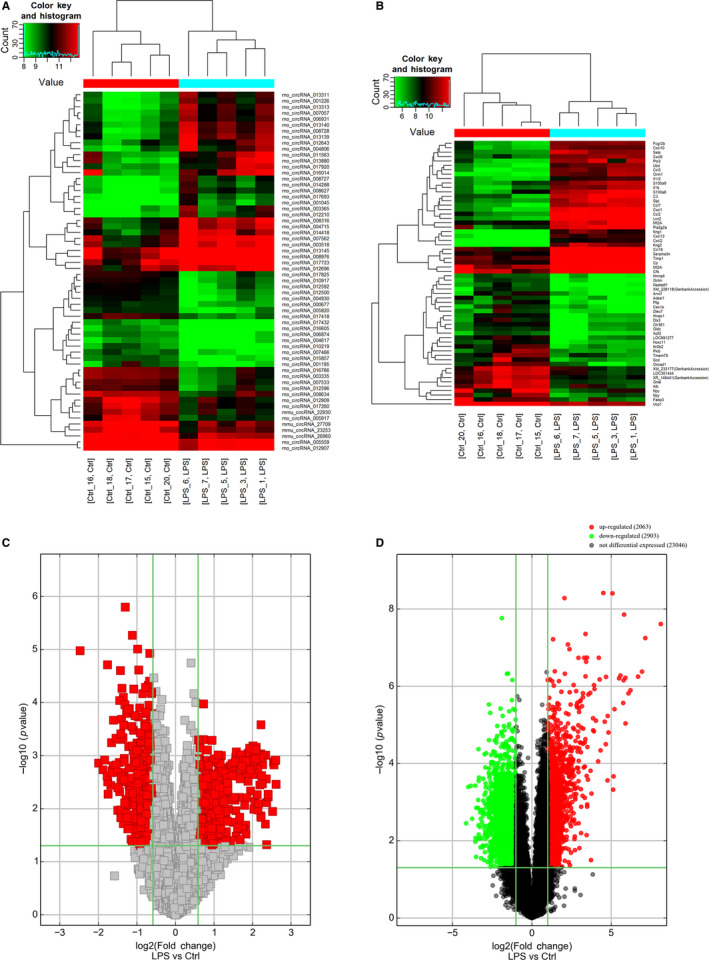
Figure 1.

Changes in the expression profiles of circRNAs and mRNAs. Heat maps showing the expression profiles of (A) circRNAs and (B) mRNAs. Volcano plots presenting differences in the expression of (C) circRNAs and (D) mRNAs between LPS and Ctrl groups. Values plotted on the x‐ and y‐axes represent the averaged normalized signal values of each group (log2‐scaled). Ctrl, control
