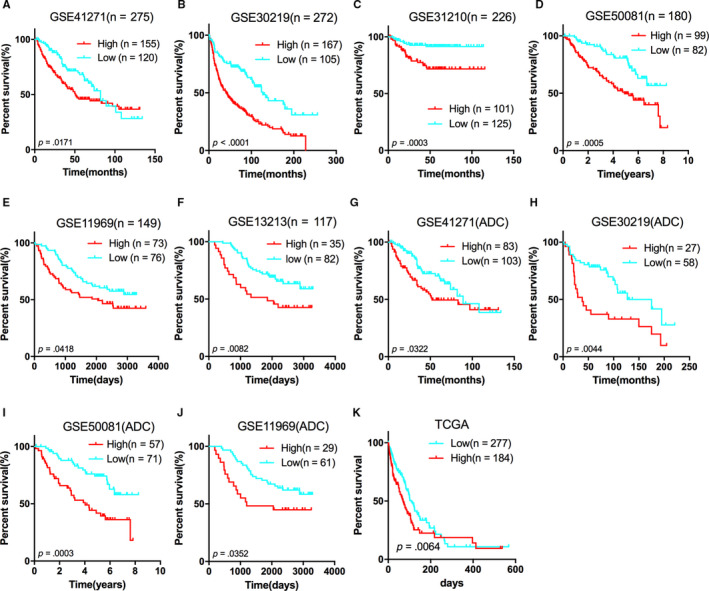
FIGURE 2.

Kaplan‐Meier estimates of the survival of GEO patients according with UHRF1 expression. The Kaplan‐Meier plots were used to visualize the overall survival for the high UHRF1 expression vs low UHRF1 expression group of patients based on the mean value A, GSE41271; B, GSE30219; C, GSE31210; D, GSE50081; E, GSE11969; F, GSE13213; G, GSE41271; H, GSE30219; I, GSE50081; J, GSE11969; K, TCGA ADC Provisional. The tick marks on the Kaplan‐Meier curves represent the censored patients. The differences between the two curves were determined by the two‐sided log‐rank test
