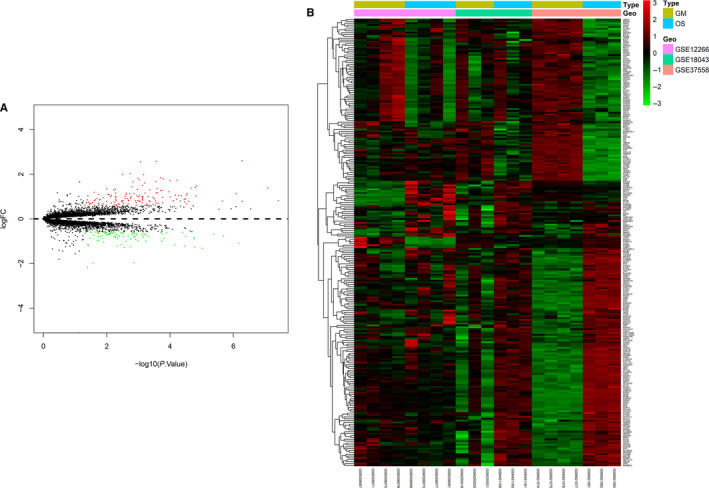
Figure 1.

DEGs. A volcano plot (A) and heat map (B) showing the 240 differentially expressed genes. Red colour indicates up‐regulated genes, and green indicates down‐regulated genes. Group GM: cells treated with growth medium. Group OS: cells treated with osteogenic differentiation. P < .05, logFC > 0.584963
