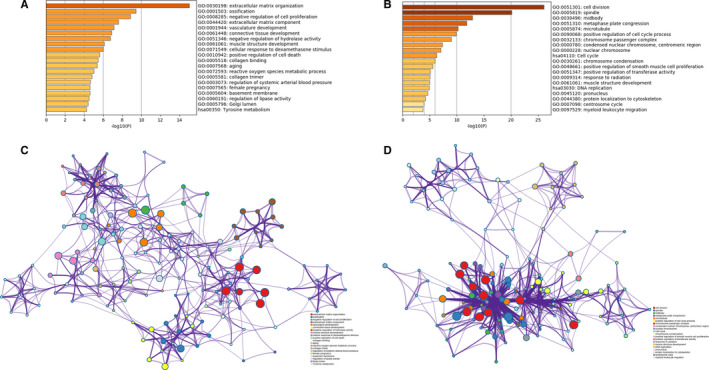
Figure 2.

Functional enrichment analysis of DEGs Bar graph showing the top 20 results from enrichment analyses of up‐regulated genes (A) and down‐regulated genes (B). P value is shown in colour. The network of enriched terms of up‐regulated genes (C) and down‐regulated genes (D), showing the top 20. Each cluster ID is indicated with a specific colour
