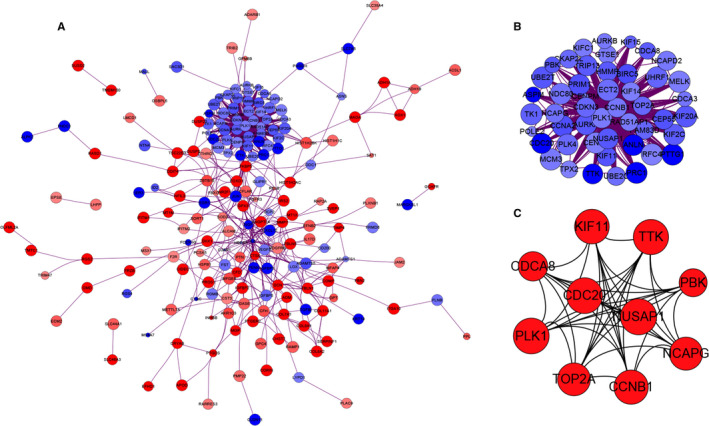
Figure 3.

PPI network construction and module analysis (A) The PPI network of DEGs. The up‐regulated genes are marked in red, while the down‐regulated genes are marked in blue. The greater the difference in expression, the darker the colour. The size of nodes represents the difference in expression; the larger the size, the more significant the P value. B, The densest connected regions (48 nodes, 1056 edges) in the PPI network were identified with Cytoscape. C, Ten hub genes were identified in the densest connected regions with MCC algorithm, using cytoHubba. The score is indicated in red colour. Darker colour indicates a higher score
