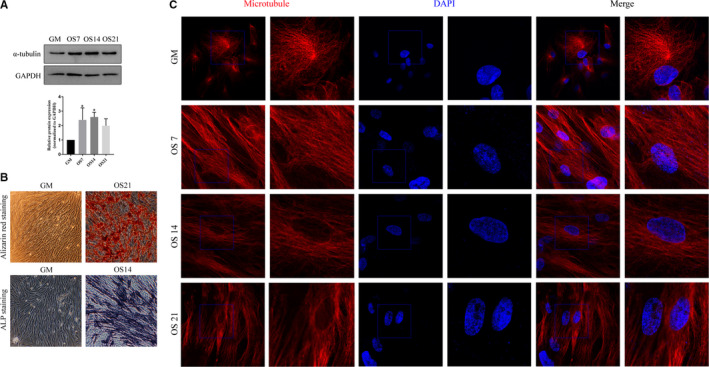
Figure 6.

Microtubule changes during osteogenic differentiation of hASCs (A) Protein expression analysis of α‐tubulin; the upper is the band diagram for the Western blot, and the lower is the corresponding statistical analysis diagram. GAPDH was used as the internal reference gene. The results are presented as Mean ± SD, n > 3. *compared with GM, P < .05. B, Alizarin red staining and ALP staining. Bar = 50 µm. C, Morphological changes in microtubules during the osteogenic differentiation of hASCs. Bar = 10µm. Microtubules are marked in red, the nucleus in blue. GM: cells cultured in growth medium; OS7, OS14 and OS21: cells cultured in osteogenic differentiation medium for 7, 14 and 21 d, respectively
