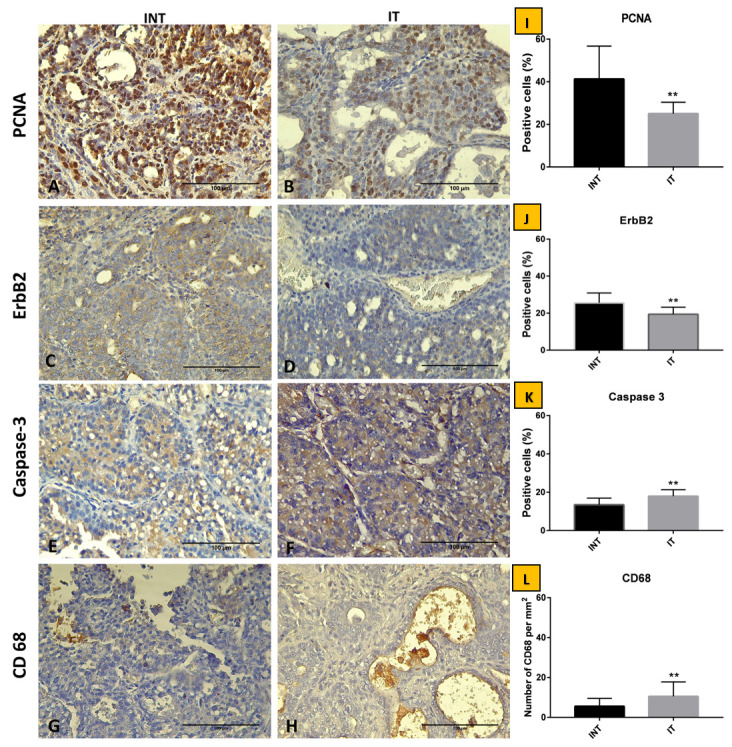
Figure 3. Immunostaining of breast adenocarcinoma tissue sections after ECCT treatment.

( A and B) Anti-PCNA, ( C and D) anti-ErbB2, ( E and F) anti-Caspase-3, ( G and H) anti-CD68. Percentage of positive cells of ( I) PCNA, ( J) ErbB2, and ( K) Caspase-3 in 50 fields of view. ( L) Count of total macrophages in 50 fields of view. Observation of histological slide was performed using Leica CC50 E at 0.5 µm/pixel resolution at 400x. Bar=100 µm. The mean, standard deviation of the data experiment show *, p<0.05, **, p<0.01. INT= DMBA-induced rats without EF therapy, IT= DMBA-induced rats with EF therapy exposure.
