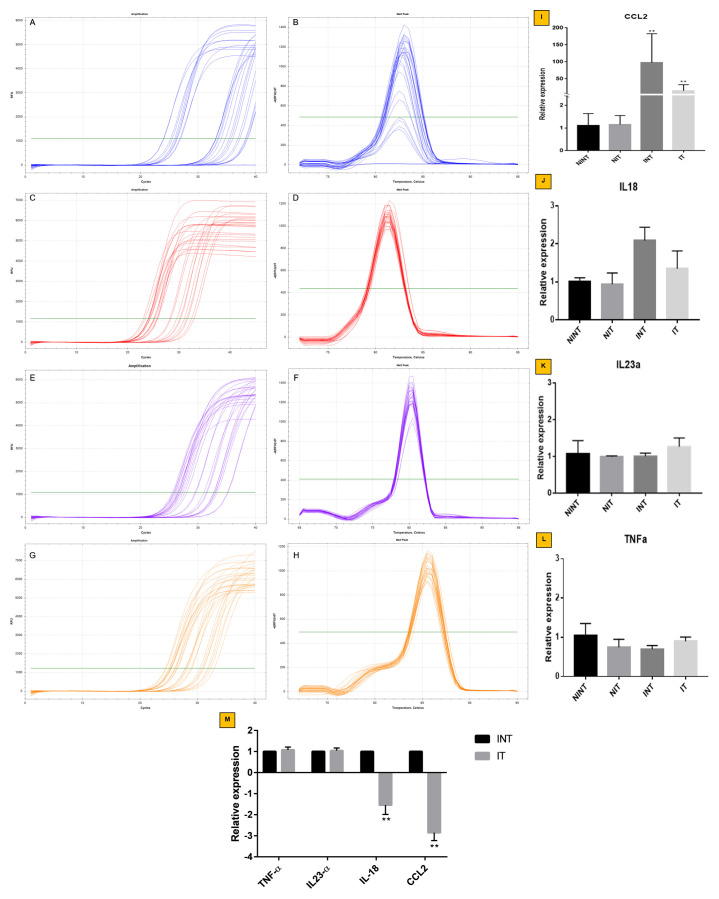
Figure 4. Relative mRNA expression of CCL2, IL-18, IL23α, and TNF-α in solid breast cancer after ECCT treatment.
Amplification and melt peak chart of ( A and B) CCL2, ( C and D) IL18, ( E and F) IL23α and ( G and H) TNF-α. Relative expression of ( I) CCL2, ( J) IL-18, ( K) IL23α and ( L) TNF-α genes with NINT as a control group. The internal control of relative gene expression is GADPH gene. ( M) Relative expression of TNF-α, IL23α, IL-18, and CCL2 INT vs. IT. Error bar shows a standard deviation of three replications; **p<0.01.

