FIG 9.
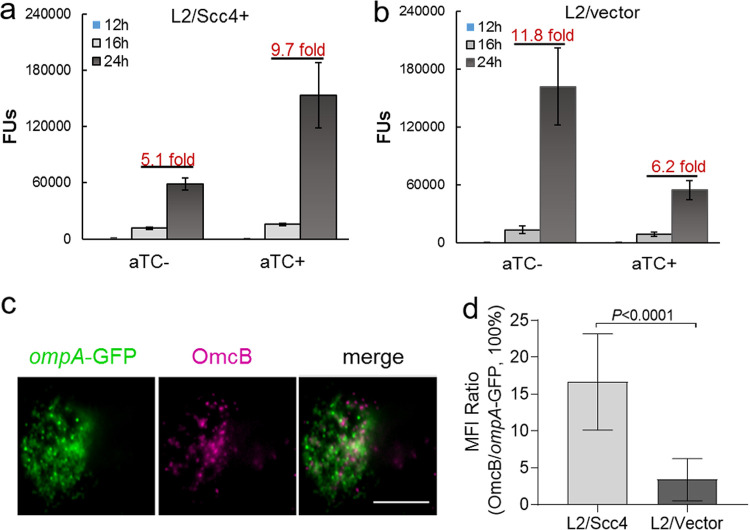
Effect of Scc4 on EB production. (a and b) Monitoring the appearance of EBs in the presence or absence of aTC. HeLa cells were infected with L2/Scc4 (a) or L2/vector (b). EB progeny were assessed by IFU assays with samples collected at different time points as indicated (for a one-step growth curve, see Fig. S4 in the supplemental material). The data are presented as means ± SD. Numbers above the bars give the fold increase from 16 to 24 hpi. (c and d) Analysis of EB-specific OmcB expression using IFA. C. trachomatis-infected cells were cultured in the medium containing aTC, fixed at 24 hpi, and subjected to IFA with anti-OmcB antibody, followed by staining with Alexa Fluor 405-conjugated anti-rabbit IgG. (c) Shown are chlamydial inclusions containing green fluorescent protein (GFP)-positive C. trachomatis (green) and OmcB-labeled EBs (purple pseudocolor). Bar, 10 μm. (d) Ratio of mean fluorescence intensity (MFI) of OmcB-labeled EBs to GFP-positive organisms per inclusion. Error bars represent means ± SD obtained from 30 inclusions per condition. The P value was obtained using an unpaired t test.

