Figure 3.
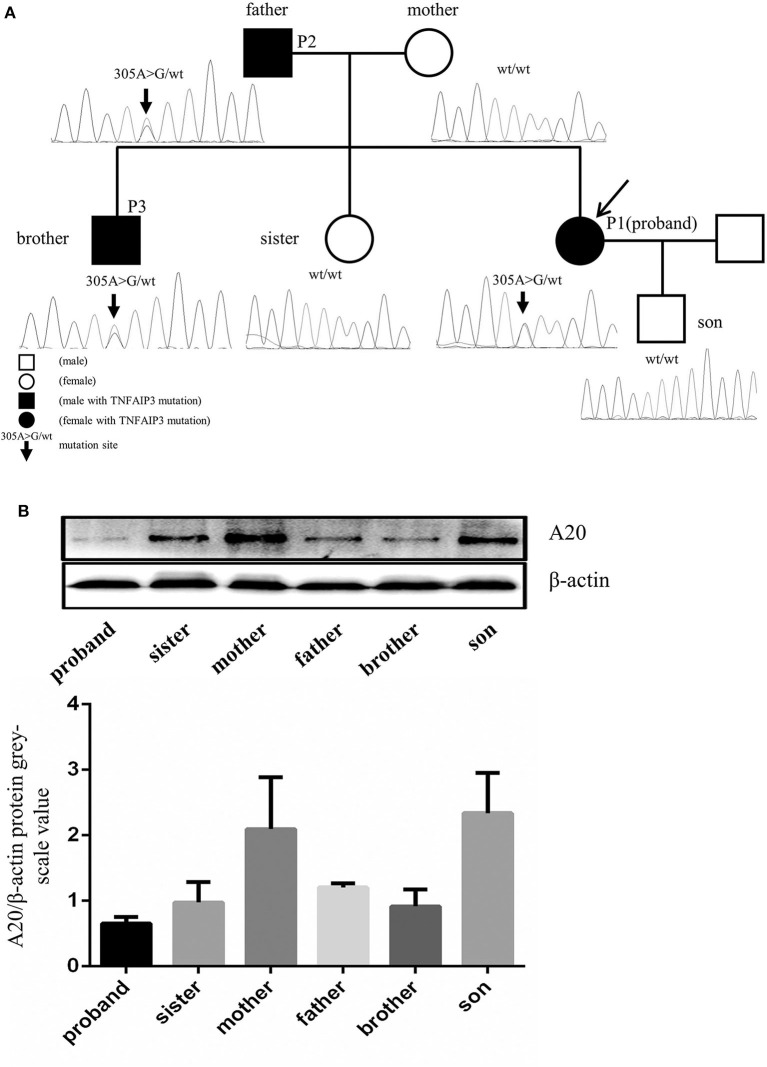
TNFAIP3 mutation and the A20 expression in PBMC of the proband and her family members. (A) Sequencing analysis of the TNFAIP3 gene among the proband and her family members revealed a heterozygous mutation (c.305A>G, p. Asn 102 Ser) in the proband, her father and her brother. (B) Western blot analysis showed that TNFAIP3 expression in PBMC from the patient, her father, brother and sister were decreased as compared to other family members without TNFAIP3 mutation. The bar graph represented semi-quantification of Western blot analysis from 3 independent experiments.

