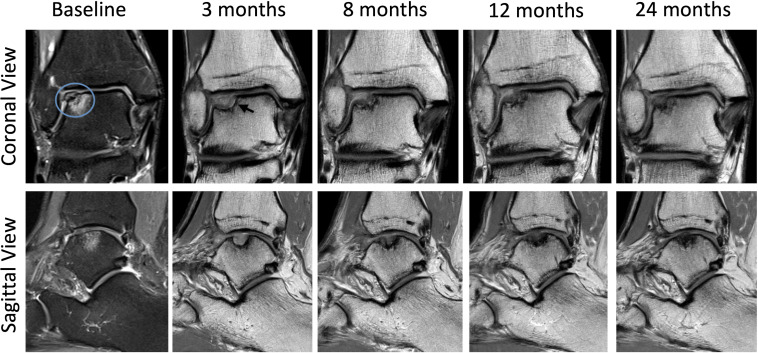
Figure 2.
Sequential coronal and sagittal MRI images from baseline to 24 months showing progressive articular cartilage regeneration. Baseline PD fat-saturated MRI of the ankle confirmed an OCL. The area of bony oedema deep to the OCL border indicates instability (blue circle). PD coronal and sagittal images at 3, 8, 12 and 24 months of follow-up. The coronal view at 3 months indicates an area of lucency beneath the area of cartilage regeneration (black arrow). This resolves with subsequent imaging. OCL, osteochondral lesion; PD, proton density.

