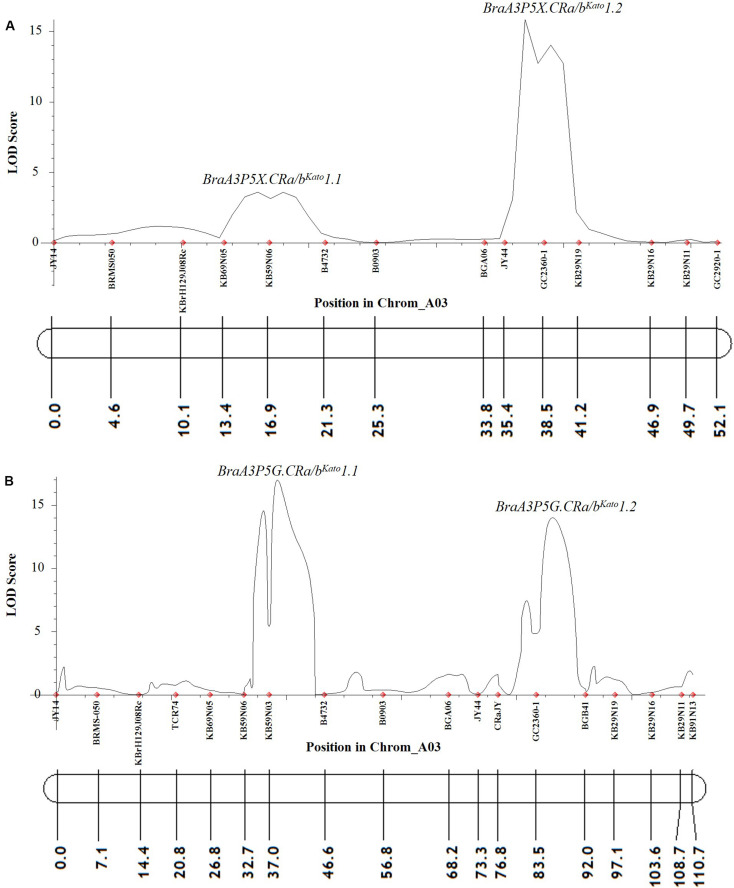
FIGURE 3.
QTL likelihood profile and partial linkage map of the A03 chromosome of Brassica napus and Brassica rapa showing resistance to P. brassicae pathotypes 5X (A) and 5G (B) in Popl#1. The LOD scores are indicated on the y-axis while the marker names and the genetic distances (in cM) are indicated on the x-axis. Two QTLs were detected for resistance to pathotypes 5X (A) and 5G (B). The first QTL (BraA3P5X.CRa/bKato1.1 and BraA3P5G.CRa/bKato1.1) was detected in the genomic region where the CRbKato gene was mapped (Kato et al., 2012, 2013) while the second QTL (BraA3P5X.CRa/bKato1.2 and BraA3P5G.CRa/bKato1.2) was detected in the genomic region where the CRa gene was mapped (Matsumoto et al., 1998, 2012; Hayashida et al., 2008; Ueno et al., 2012).

