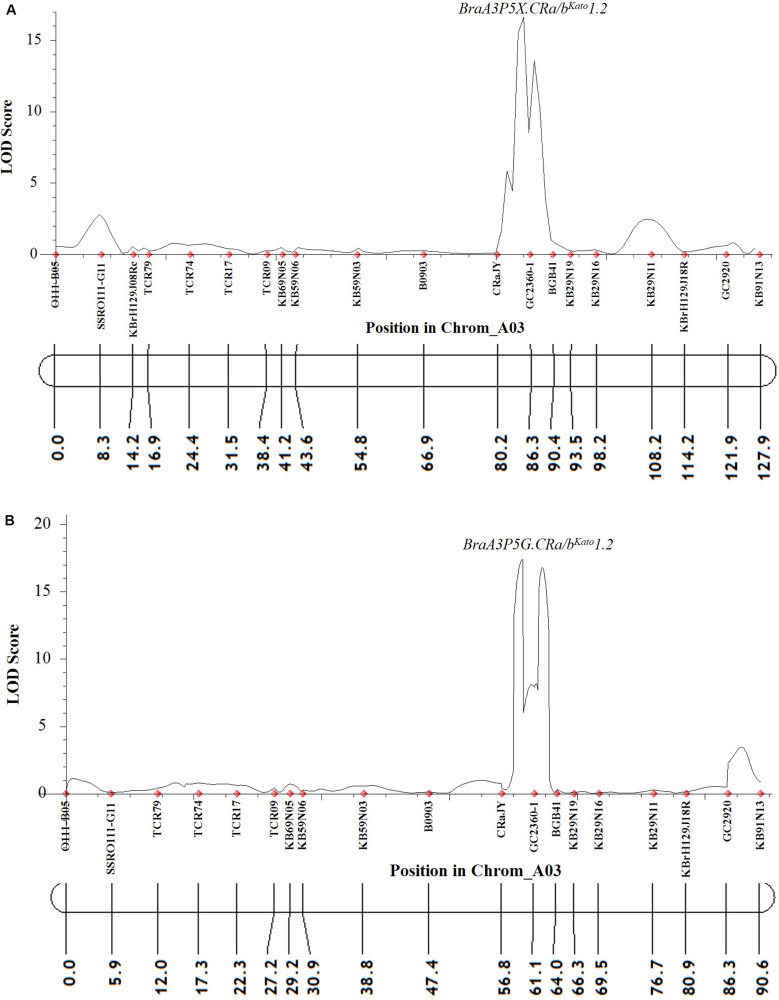
FIGURE 4.
QTL likelihood profile partial linkage map of the A03 chromosome of B. napus and B. rapa showing resistance to two P. brassicae pathotypes 5X (A) and 5G (B) in Popl#2. Pathotypes 5X and 5G used in the inoculation experiments could overcome clubroot resistance in commercial canola cultivars (Strelkov et al., 2016, 2018). The LOD scores are indicated on the y-axis while the marker names and the genetic distances (in cM) are indicated on the x-axis. Only one QTL (BraA3P5X.CRa/bKato1.2 and BraA3P5G.CRa/bKato1.2) was detected for resistance to pathotypes 5X (A) and 5G (B). This QTL was detected in genomic regions of the A03 chromosome of B. napus and B. rapa where the CRa/CRbKato gene(s) was reported (Matsumoto et al., 1998, 2012; Hayashida et al., 2008; Kato et al., 2012, 2013; Ueno et al., 2012).

