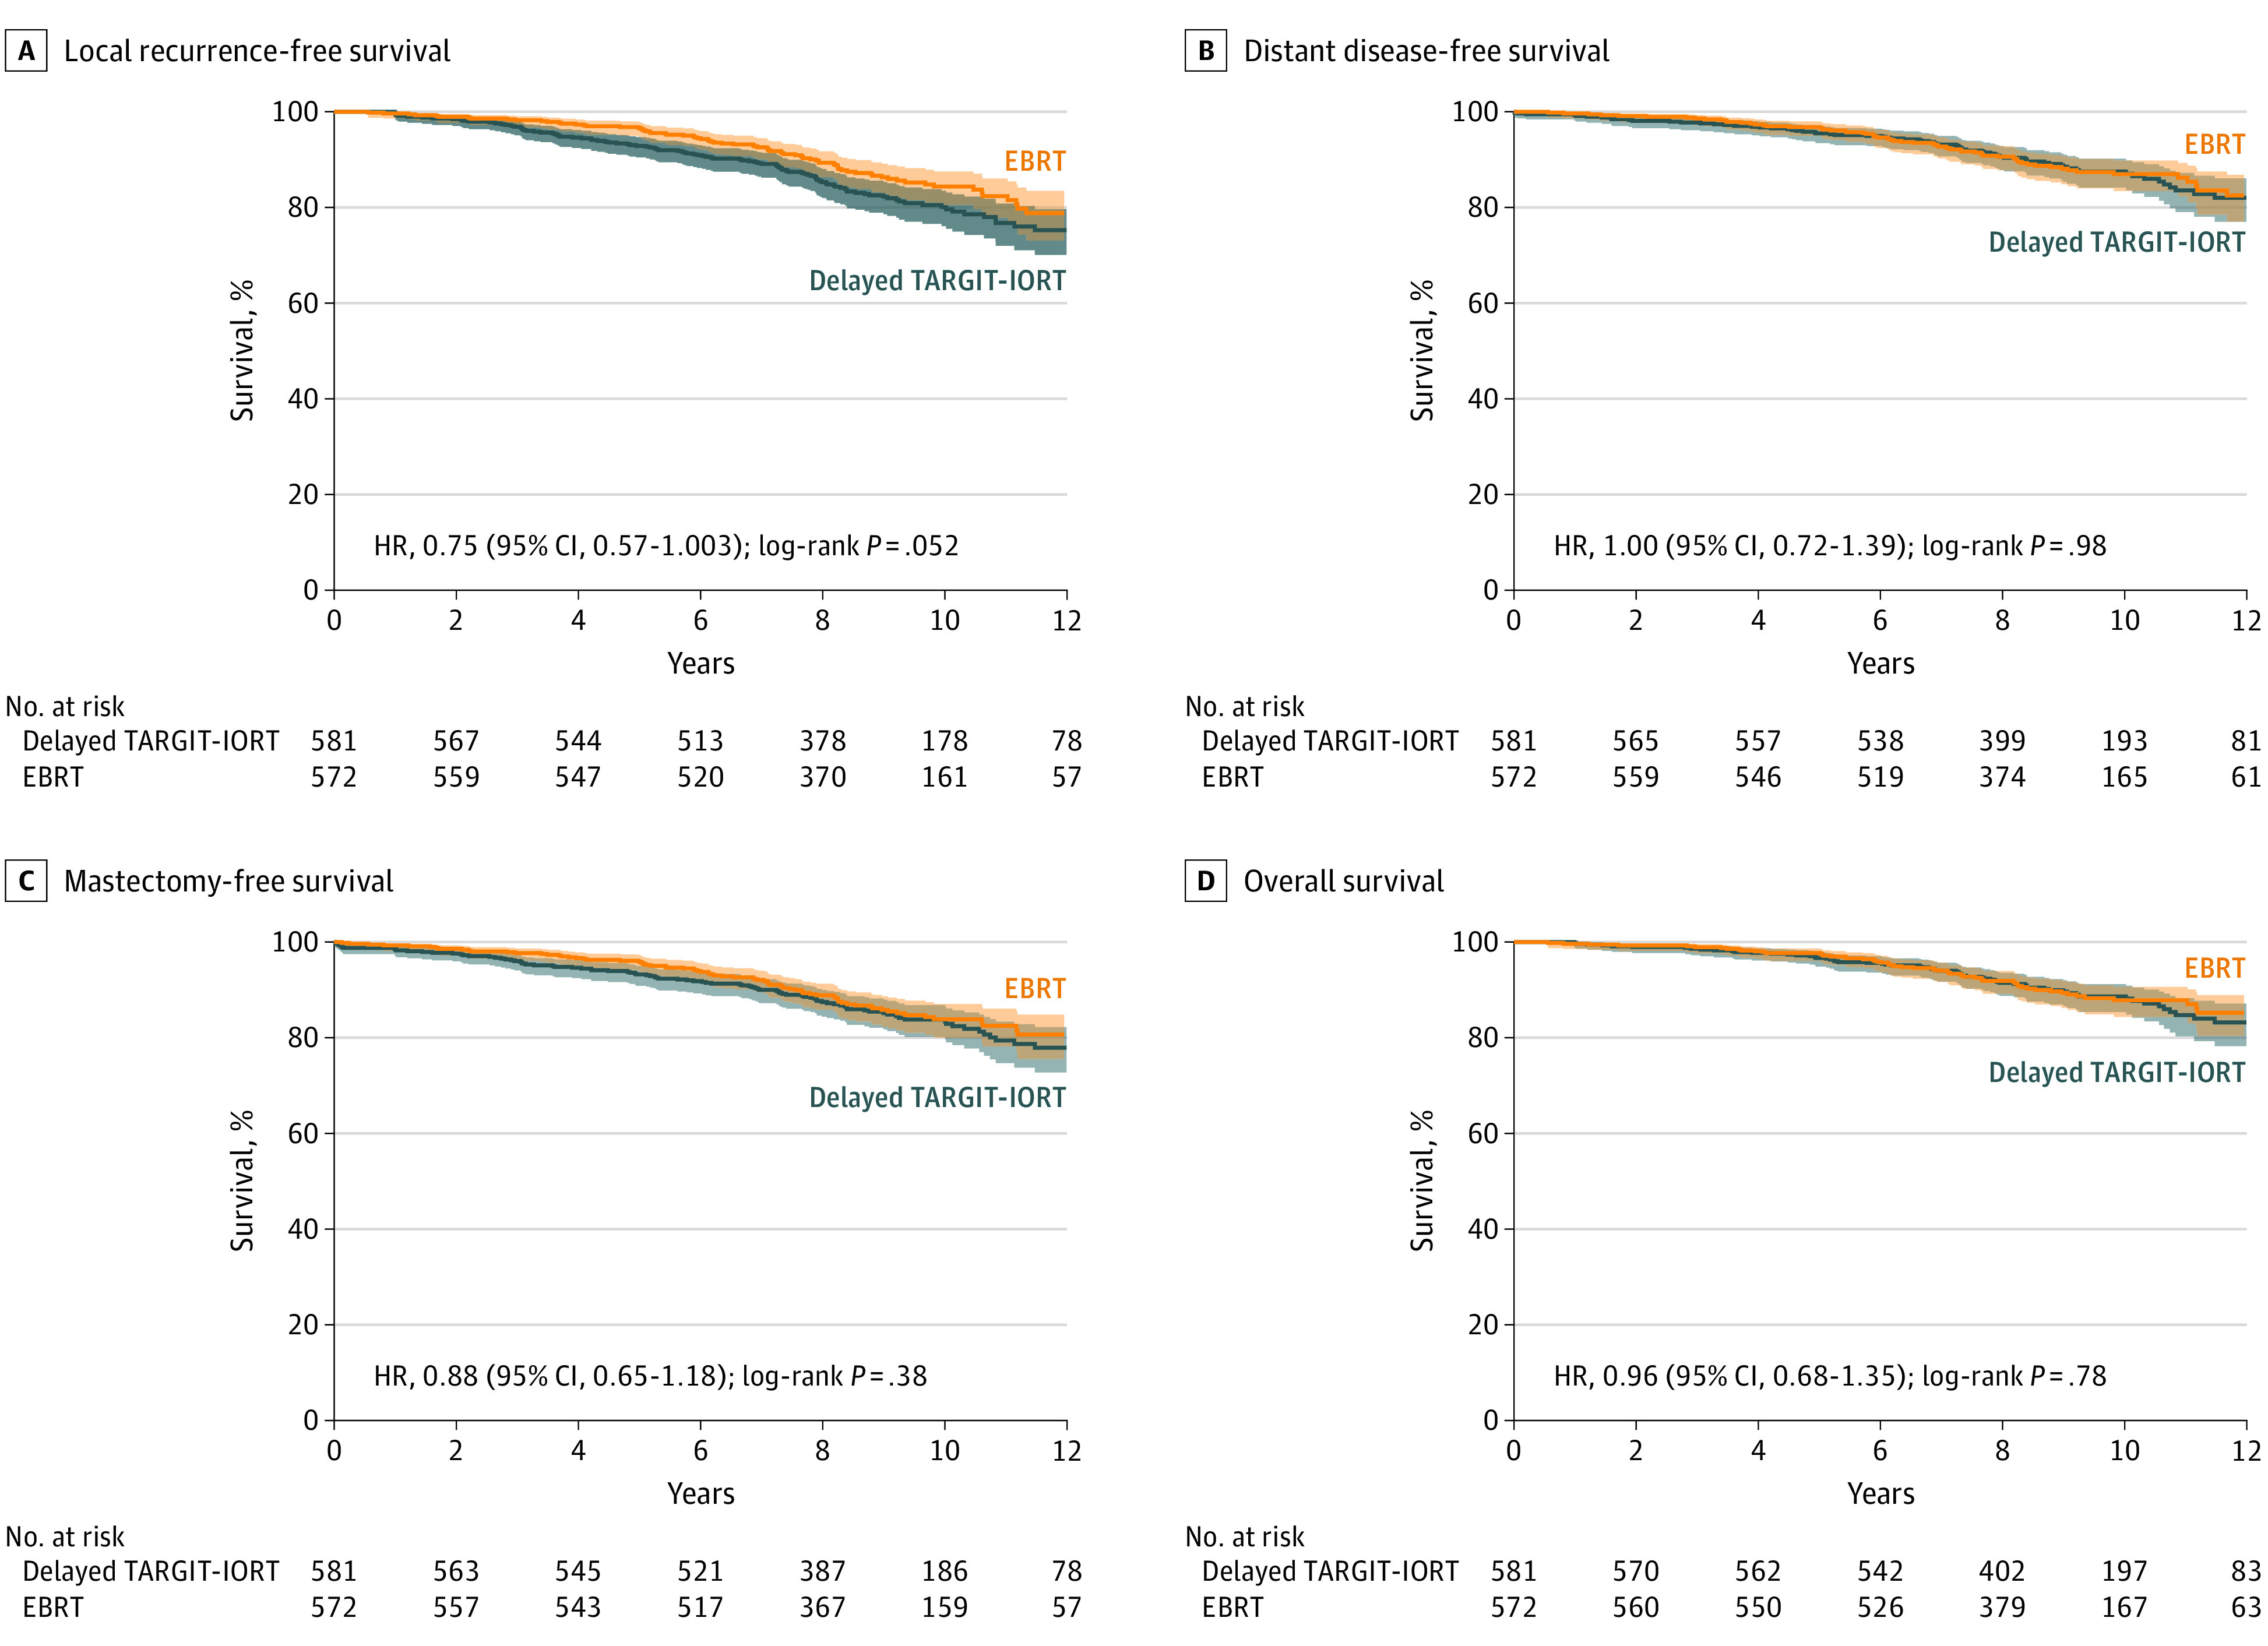
Figure 3. Twelve-Year Kaplan-Meier Curves Comparing Delayed Second-Procedure TARGIT-IORT vs EBRT.

EBRT indicates whole-breast external beam radiotherapy; TARGIT-IORT, targeted intraoperative radiotherapy. In each of these Kaplan-Meier graphs, the blue lines represent delayed TARGIT-IORT with light blue shading indicating the 95% confidence intervals. The orange lines represent EBRT with light orange shading indicating the 95% confidence intervals.
