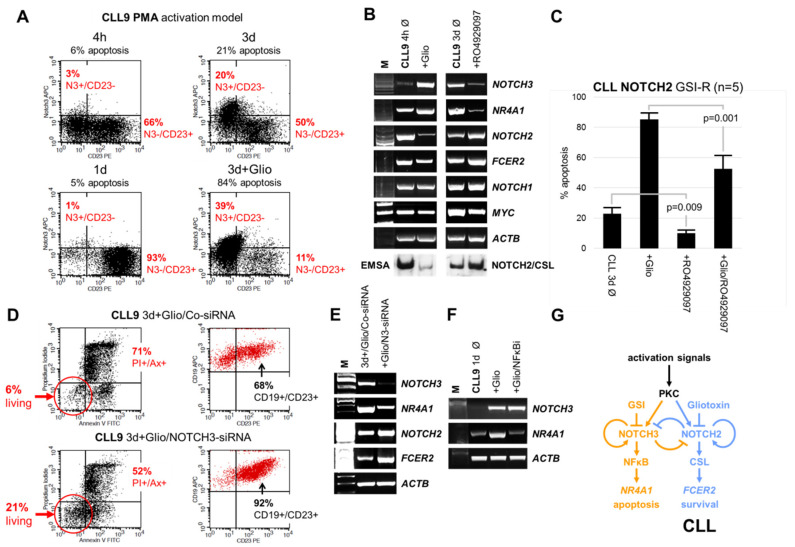
Figure 5.
NOTCH3 inhibition counteracts apoptosis in PMA-activated CLL cells. (A) FACS analysis indicating the time-dependent effect of PMA (1 ng/mL) on surface NOTCH3 and CD23 expression in CLL9 cells. (B) Corresponding RT-PCR showing the opposite effects of gliotoxin (0.2 µM) and RO4929097 (0.5 µM) on the NOTCH2/FCER2 (CD23) axis and the NOTCH3/NR4A1 axis in PMA-activated CLL9 cells. The mRNA expression of the CLL proliferation center marker MYC is indicated [41,42]. (C) FACS analysis demonstrating the inhibition of spontaneous/gliotoxin induced apoptosis by RO4929097 in NOTCH2 GSI-R CLL cells. (D) NOTCH3-siRNA counteracted gliotoxin induced apoptosis in PMA-activated CLL9 cells and enhanced surface CD23 expression on the remaining living cells. (E) Corresponding RT-PCR showing the opposite effects of NOTCH3 gene silencing on the NOTCH3/NR4A1 axis and on the NOTCH2/FCER2 axis. (F) RT-PCR showing the inhibition of gliotoxin induced NR4A1 mRNA expression by 0.1µM NFκB activation inhibitor (NFκBi). (G) Hypothetical model summarizing the proposed counteracting roles of NOTCH2 and NOTCH3 in CLL cells. Non-canonical NOTCH3 signaling which involves NFκB dependent NR4A1 expression is shown in yellow color. Canonical NOTCH2 signaling which involves CSL dependent FCER2 (CD23) expression is marked in blue. The NOTCH2 dominance in CLL is indicated. Positive and negative feedback loops of NOTCH receptor expression and function are indicated with circular arrows and bars.

