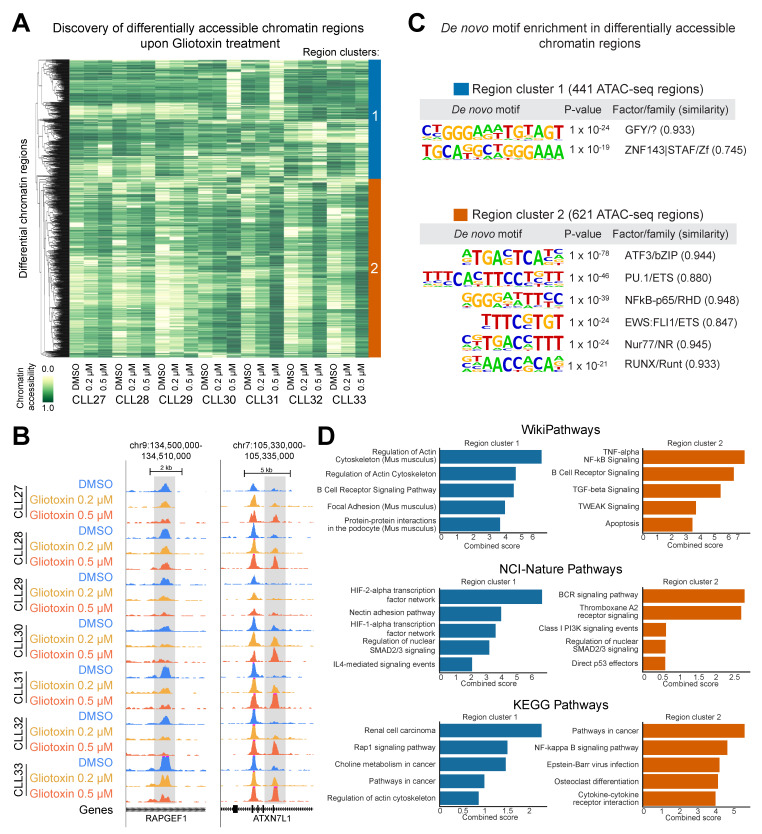
Figure 7.
Chromatin gliotoxin treatment-related changes in chromatin accessibility in CLL cells. (A) Clustered heatmap based on all the differentially accessible regions between treatment conditions. (B) Representative browser visualization of genomic regions that lost (left panel for RAPGEF1) or gained (right panel for ATXN7L1) chromatin accessibility upon gliotoxin treatment. (C) De novo motif enrichment analysis of differentially accessible regions from Region Clusters 1 and 2. (D) Most highly enriched pathways for genes associated with Region Clusters 1 and 2.

