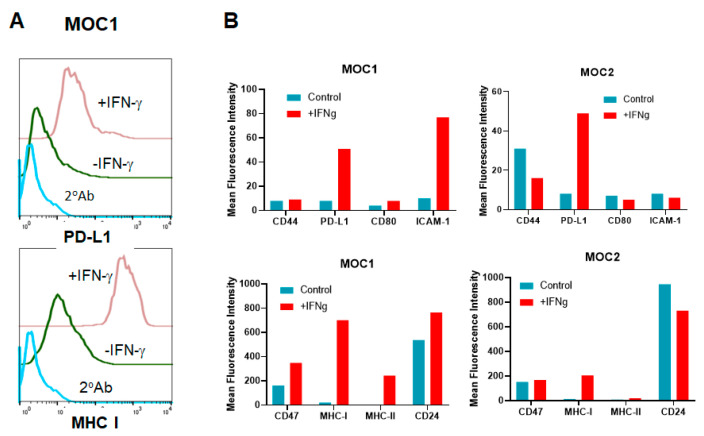
Figure 6.
IFN-γ induces MHC class I, PD-L1, ICAM-1, and MHC class II on MOC1 but only MHC class I and PD-L1 on MOC2 cells. Tumor cells (0.5 × 10⁶ cells in 3 mL) were cultured in six-well plates with or without 100 ng/mL of IFN-γ for three days. Cells were harvested and stained for surface markers and analyzed by flow cytometry. (A) Representative histograms of surface PD-L1 (upper panel) and MHC class I (lower panel) on MOC1 cells. (B) Mean Fluorescence Intensity (MFI) of surface markers on MOC1 (left bar graphs) and MOC2 (right bar graphs) is shown. Low intensity markers on the upper panels and high intensity markers on the bottom panels are shown. The MFI is calculated by the flowcytometry as mean value from 10,000 cells. Data represent one of the two experiments.

