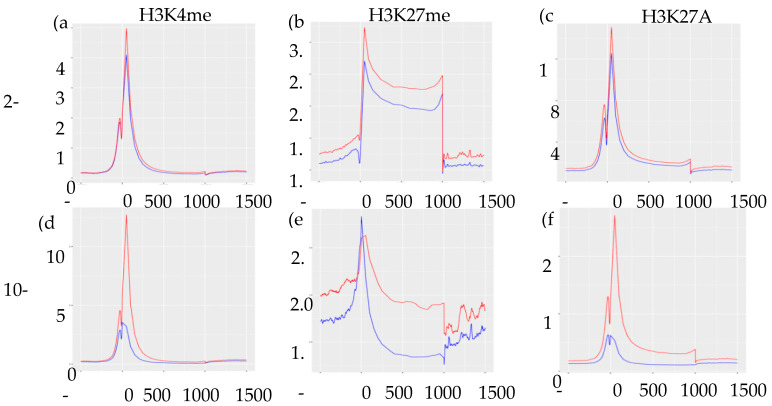
Figure 3.
Transcription start site plots (TSS plots) of histone modifications showing the distribution and enrichment of each histone mark. (a–c) represents H3K4me3, H3K27me3, and H3K27Ac marks in 2-wk islets, respectively. (d–f) represents H3K4me3, H3K27me3, and H3K27Ac mark in 10-wk islets, respectively. Peak input/enrichment shown on vertical axes and position base-pair shown on horizontal axes. Red lines indicate control islets and blue lines indicate IUGR islets.

