Figure 3.
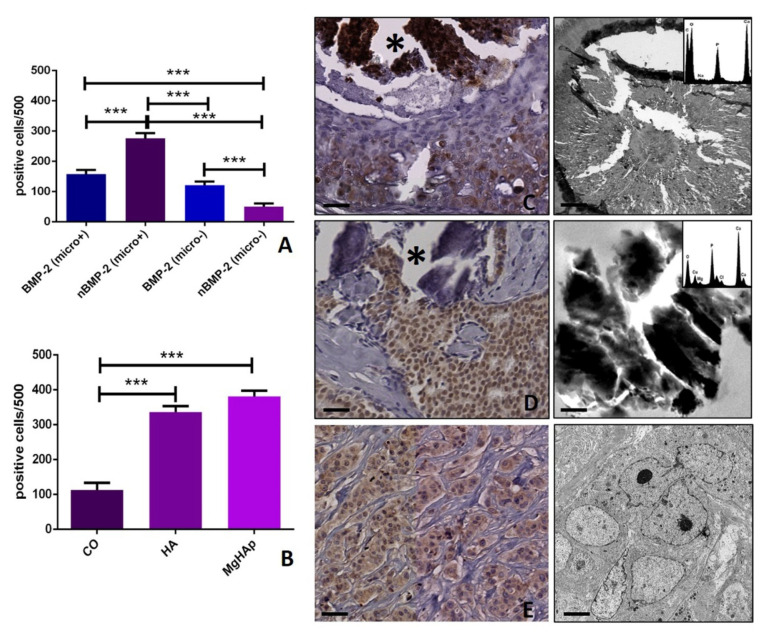
Cytoplasmic and nuclear BMP-2 in breast microcalcifications. (A) The graph displays the expression of cytoplasmic and nuclear BMP-2 in breast tissues with or without microcalcifications. (B) The graph shows the expression of nuclear BMP-2 in breast tissues with calcifications made of calcium oxalate (CO), hydroxyapatite (HA) or magnesium-substituted hydroxyapatite (Mg–HAp). The elemental composition of microcalcification has been performed on a paraffin serial section by transmission electron microscope and energy dispersive X-ray microanalysis apparatus. (C) The image shows some cytoplasmic BMP-2-positive breast cells in an infiltrating breast carcinoma next to a microcalcification (the asterisk). The transmission electron microscope and energy dispersive X-ray microanalysis show that microcalcification is made of HA (spectrum). (D) Numerous nBMP-2-positive cells in an infiltrating breast carcinoma close to a microcalcification (the asterisk). The transmission electron microscope and energy dispersive X-ray microanalysis show that microcalcification is made of Mg–HAp. (E) Cytoplasmic and nuclear BMP-2-positive breast cells in an infiltrating breast carcinoma without microcalcifications. The electron micrograph shows a cluster of infiltrating breast cancer cells. The scale bar represents 100 µm for each immunohistochemical image. Transmission electron microscope scale bars: A, 0.2 µm; B, 0.2 µm; C, 5 µm. (* p ≤ 0.05, ** p ≤ 0.01, *** p ≤ 0.001, **** p ≤ 0.0001).

