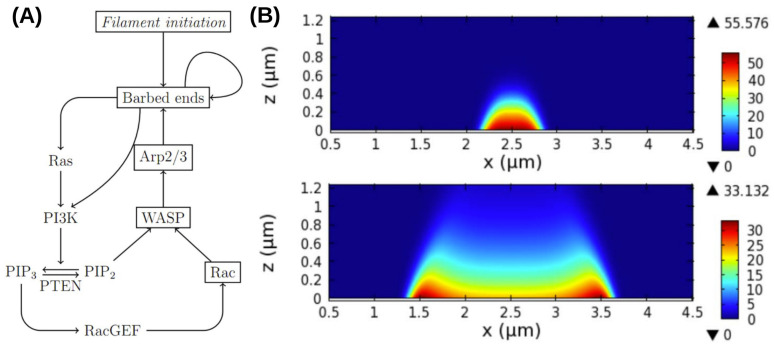
Figure 11.
(A) A schematic of the network structure and molecular interactions in the model. (B) Two snapshots in time of an actin wave initiated at x = 2.5, showing the network density (color) as a function of space (x-axis) and network height (z-axis). From Khamviwath et al. [107].

