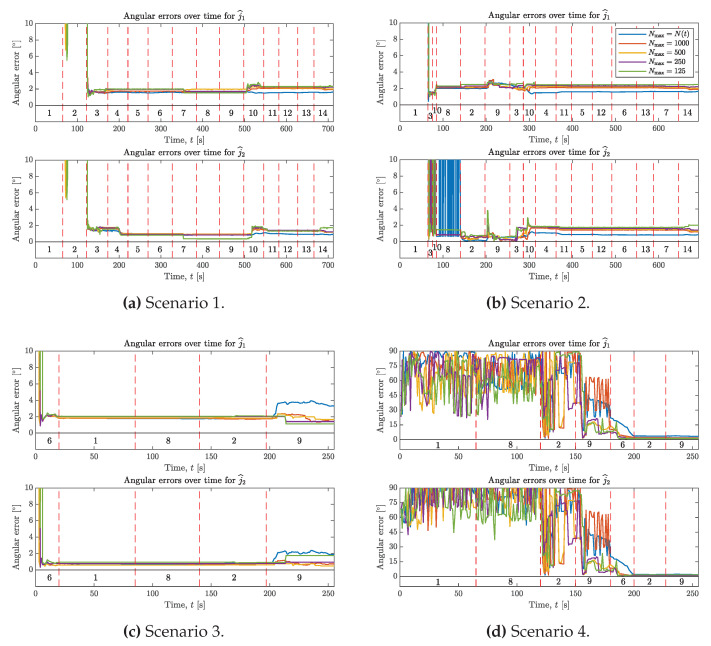
Figure 6.
Angular errors over time for the four scenarios, see (a–d). Comparing the case , where all samples up to time t are used for estimation to samples being chosen by Algorithms 2–3 at each integer t seconds. Colored lines define these different cases as given by the legend in the top right. Vertical dashed lines and the numbers 1–14 are used to indicate from which motions (see Section 7.1) the data comes from.

