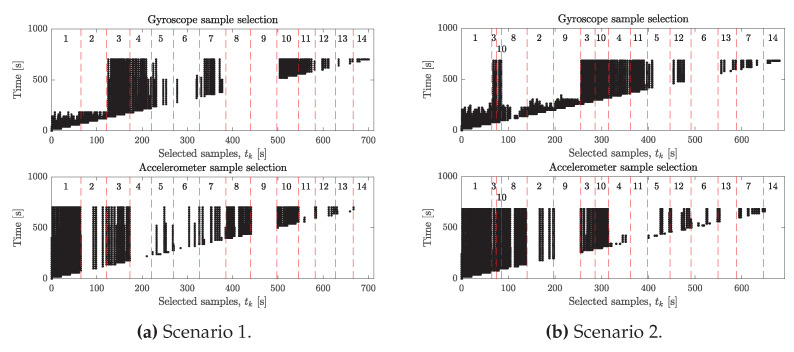
Figure 7.
The figure shows which samples from Scenario 1 (a) and Scenario 2 (b) that were selected by Algorithms 2–3 with , at the times given by the vertical axes. Black/white indicates that a sample were selected/not selected respectively. As time increases and more samples become available, we see some previously selected samples being deselected in favor of new samples that are deemed superior by the algorithms. Vertical dashed lines and the numbers 1–14 indicate from which motions (see Section 7.1) the data comes from.

