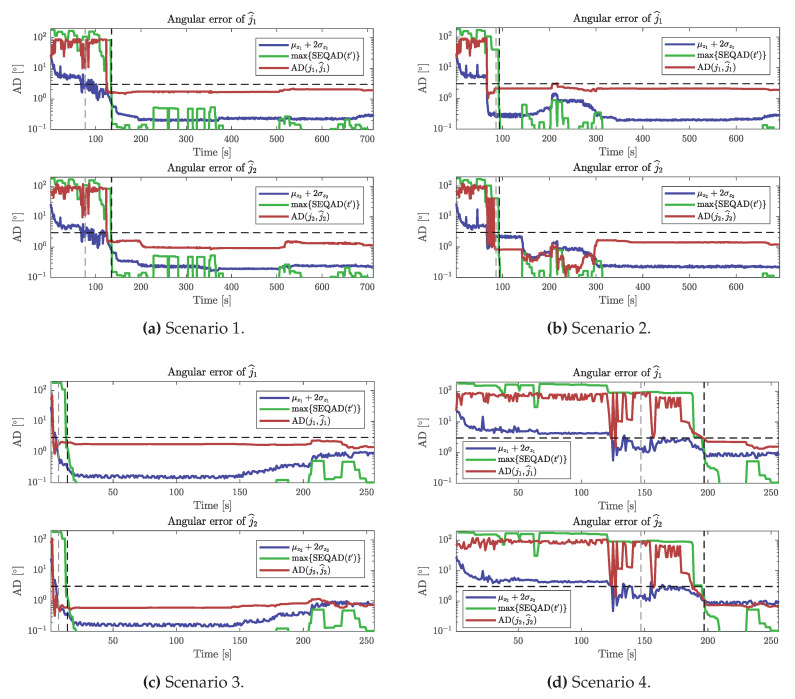
Figure 8.
The plots shows the local and global uncertainty metrics compared to the angular errors (red) for the four scenarios, see (a–d). Local uncertainty is quantified by , where is the estimated mean AD (64) and is the standard deviation, computed from the estimated covariance matrix (65). Local uncertainty (blue) is shown for both and for each scenario. Global uncertainty is quantified by (68). The global uncertainty (green) with is shown for each scenario. Horizontal dashed lines show the accuracy threshold . Vertical dashed lines show when estimates were accepted by Algorithm 4. For each scenario, the leftmost vertical lines show the case of and the rightmost vertical lines show the case of , where Algorithm 4 terminates when the estimates have reached the desired accuracy w.r.t. ground truth.

