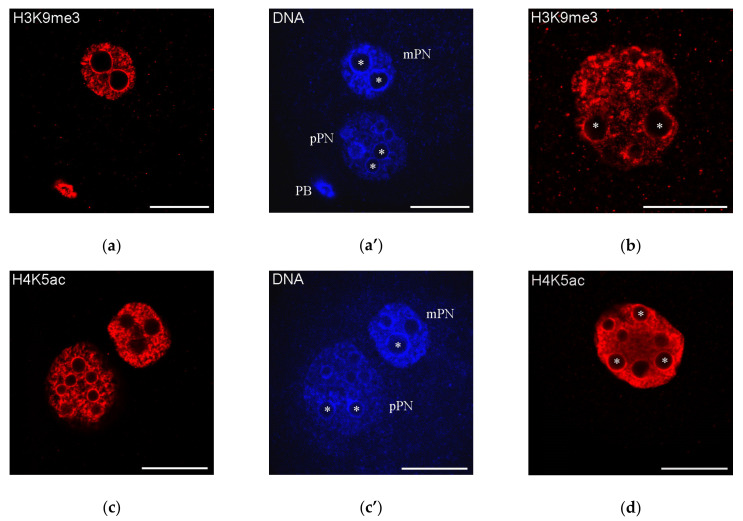
Figure 4.
Distribution of H3K9me3 and H4K5ac—the representative marks of “repressed” and “active” chromatin, respectively—in mouse zygotes (a,c; a’,c’, DAPI staining) and two-cell embryos (b,d); both marks are detected in the heterochromatin rings around nucleolus precursor bodies (some marked with asterisks); mPN, maternal pronucleus; pPN, paternal pronucleus; PB, polar body. Note that H3K9me3 is revealed in mPN but not in pPN. Scale bars represent 20 μm.

