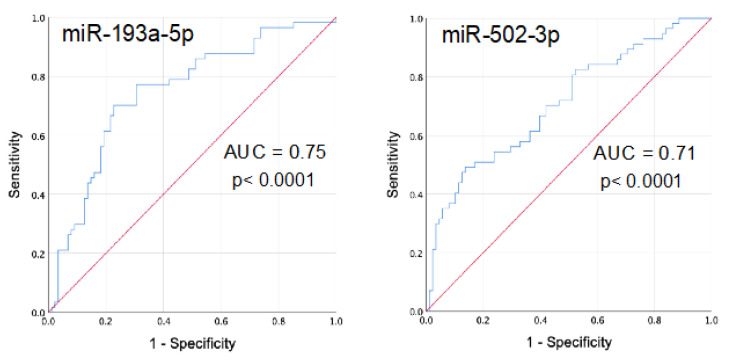
Figure 5.
Receiver operator characteristic (ROC) curve analysis of circulating miR-193a-5p and miR-502-3p among ILA and Ctrl. Graphs show the ROC curve of miR-193a-5p and miR-502-3p as a single biomarker for predicting the presence of interstitial lung abnormalities in asymptomatic subjects. AUC: area under the curve. ILA: subjects with interstitial lung abnormalities. Ctrl: control group.

