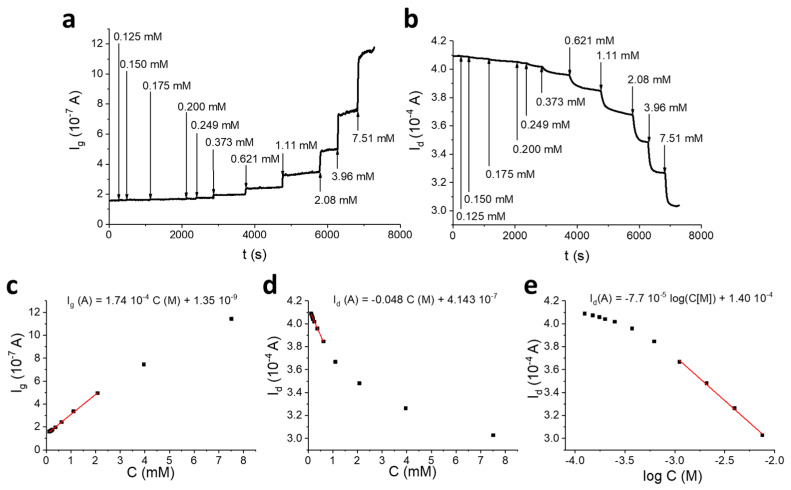
Figure 5.
OECT biosensor for glucose detection. Ig (a) and Id (b) vs. time curves obtained for the OECT with Ag/Ach = 4, following the addition of different glucose amounts (Vgs = +0.8 V; Vds = +0.1 V) in 0.1 M phosphate buffer solution (PBS, pH = 7.00). The additions are indicated with an arrow. Plots of Ig (c) and Id (d) as a function of glucose concentration and plot of Id as a function of the logarithm of glucose concentration (e).

