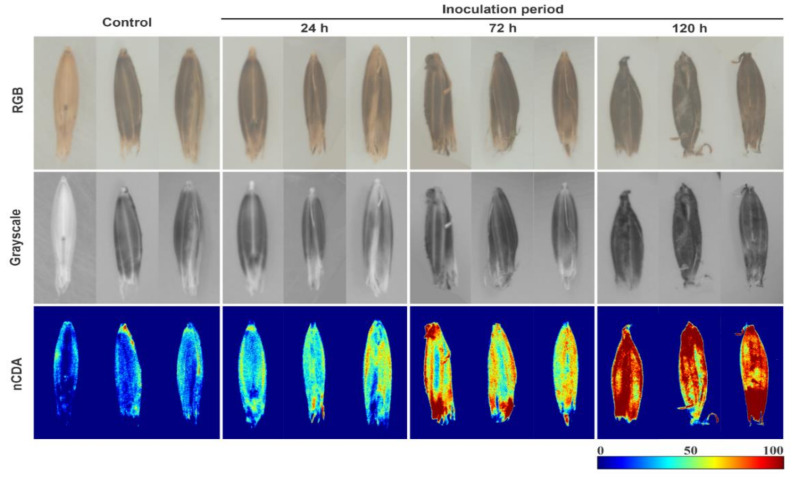
Figure 3.
Raw images and corresponding grayscale and nCDA images of black oat seeds at 365 nm for fungus-free seeds (control), and seeds exposed to Drechslera avenae (Eidam) Sharif for 24, 72 and 120 h. In the images transformed by nCDA algorithm, blue color represents healthy tissues, green and yellow colors are intermediate contamination, and red color indicates higher fungal contamination.

