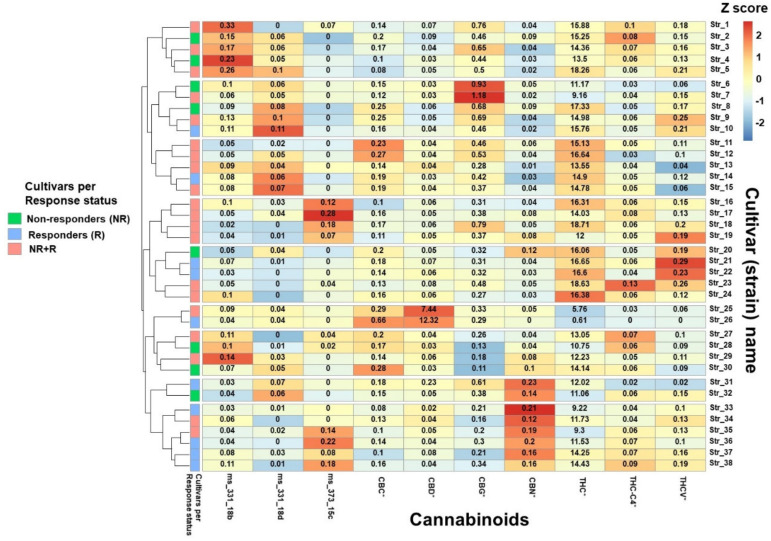
Figure 2.
Relative phytocannabinoid concentrations in the most frequently consumed cultivars. Colors on the graph represent the scaled phytocannabinoid concentration variations between cultivars; the numbers in each box represent the concentration (% w/w) of the specific phytocannabinoid within each cultivar. Note: * for each phytocannabinoid, the concentrations of the acid and its neutral counterpart were summed and reported as the total content; Method used: package “pheatmap”, function pheatmap, with the “Euclidean” (default) distance measure used in clustering rows, “complete” clustering method used on z-scored data scaled by row. Note: THC, (-)-Δ9-trans-tetrahydrocannabinol; CBD, cannabidiol; CBC, cannabichromene; CBG, cannabigerol; CBN, cannabinol; THC-C4, (-)-Δ9-trans-tetrahydrocannabinol-C4; THCV, (-)-Δ9-trans-tetrahydrocannabivarin.

