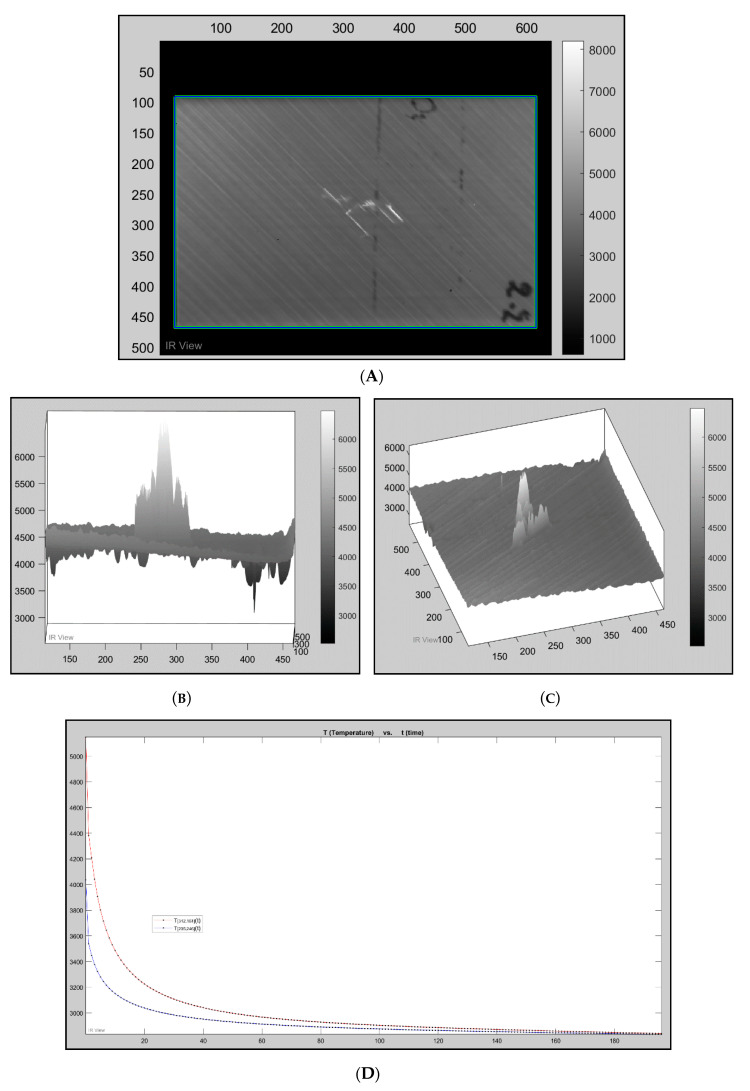
Figure 9.
(A) 2.2CooledFront, frame 4, where the flash hit the specimen. (B) 2.2CooledFront, frame 4, where the flash hit the specimen. Three-dimensional (3D) pixel map side angle. (C) 2.2CooledFront, frame 4, where the flash hit the specimen. 3D pixel map top angle. (D) Temperature vs. time graph; the black dots each represent a frame (blue—sound pixel; red—defected pixel).

