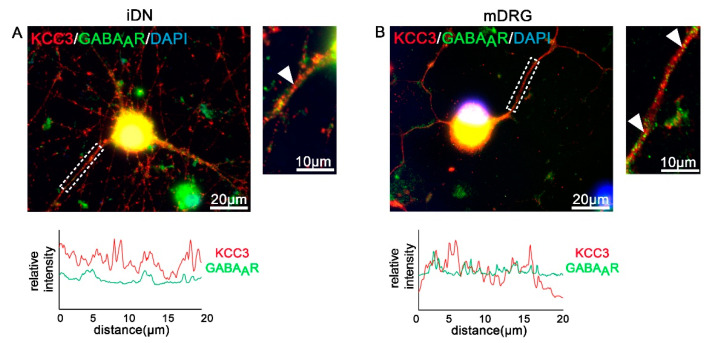
Figure 7.
Quantification of KCC3/GABAAR clustering on iDNs and mouse DRG neurons. (A,B) Both day 40 iDNs and mouse DRG neurons stained positive for KCC3-IR and GABAAR labeling (arrow heads neurite selections). Line scan analyses on 20 µm neurite structures were performed. (A) Lower intensity levels of GABAAR clustering in iDNs were elucidated as compared with mouse DRGs (B). 2–3 individual differentiations, scale bars 20 µm and 10 µm (enlargement), line scan was set to 20 µm.

