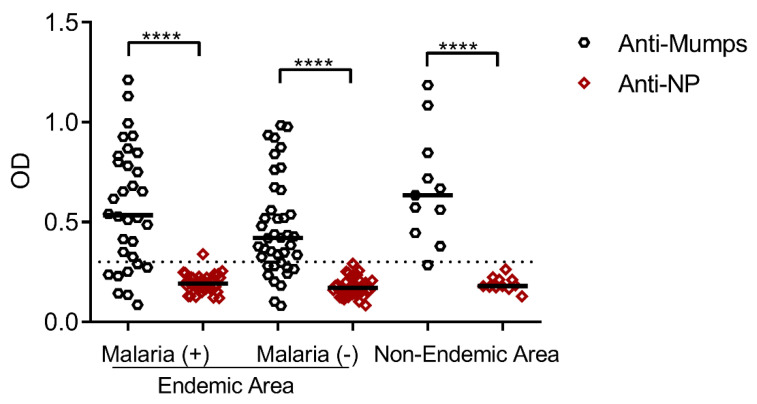
Figure 3.
Comparison of antibody response against the mumps virus and nucleocapsid proteins (NPs). The serology of P. vivax-infected individuals (n = 40), non-infected individuals (n = 40), and individuals who were immunized or had mumps from a non-endemic P. vivax area (n = 12) was investigated using a commercial ELISA kit. The dashed line in the chart indicates the minimum threshold (OD = 0.3) for considering an individual to be immunized against the mumps virus, as indicated in the supplier’s manual. The results were statistically compared using one-way ANOVA followed by Tukey’s test. Significant differences between groups are denoted on the graph: * p < 0.05, ** p < 0.01, *** p < 0.001, and **** p < 0.0001. Non-significant (ns) differences are indicated (p > 0.05).

