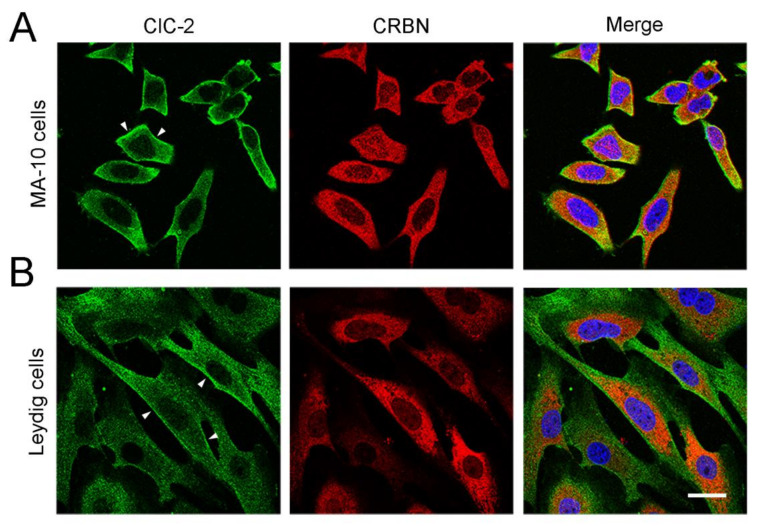
Figure 9.
Subcellular localization of endogenous ClC-2 and CRBN. Representative confocal micrographs showing the immunofluorescence staining patterns of endogenous ClC-2 (green) and CRBN (red) in MA-10 cells (A) and cultured mouse Leydig cells (B). Merged images of ClC-2 and CRBN signals are shown in the rightmost panels, where cells were also stained with DAPI (blue) as a nuclear counterstain. Fixed cells were stained with the indicated antibodies under the permeabilized configuration. Arrowheads denote plasma membrane localization of ClC-2. Scale bar = 25 μm. Data are representative of three independent experiments.

